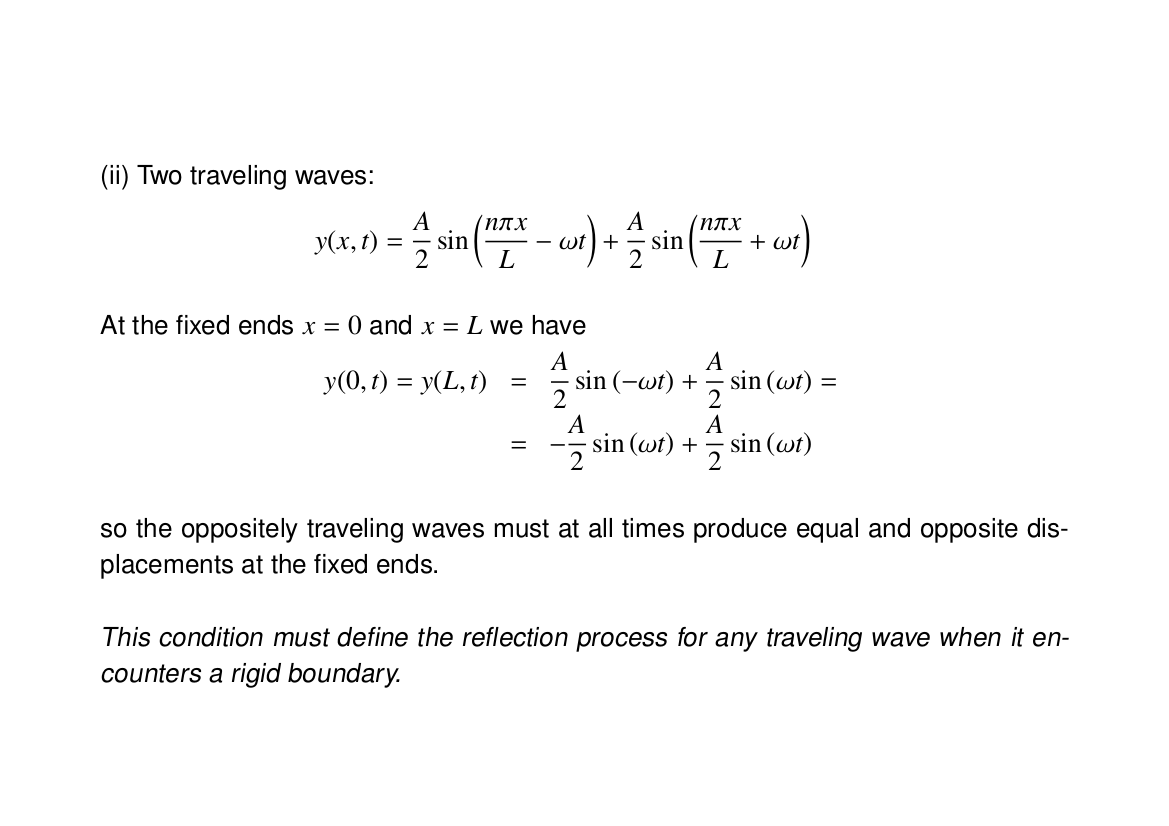
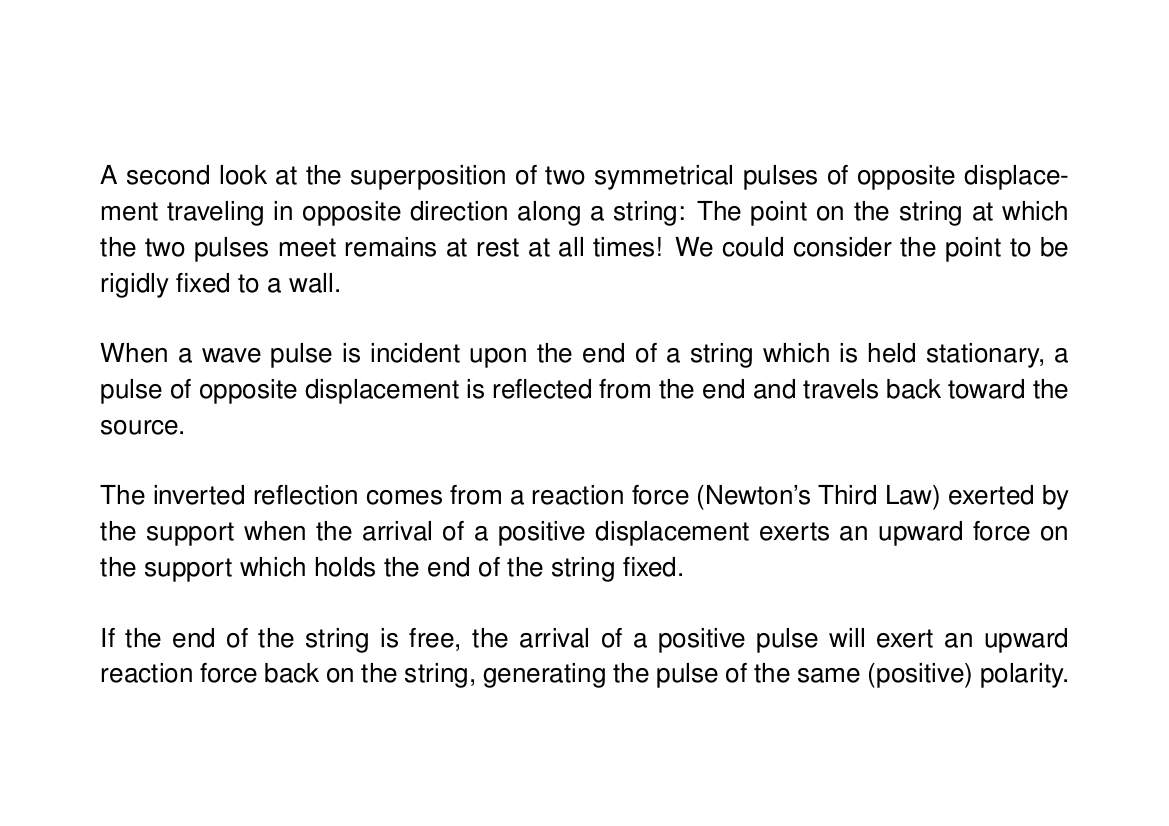
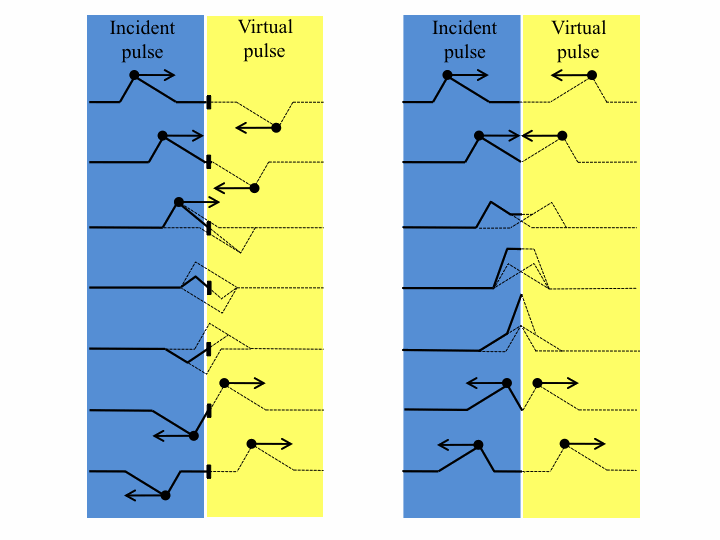
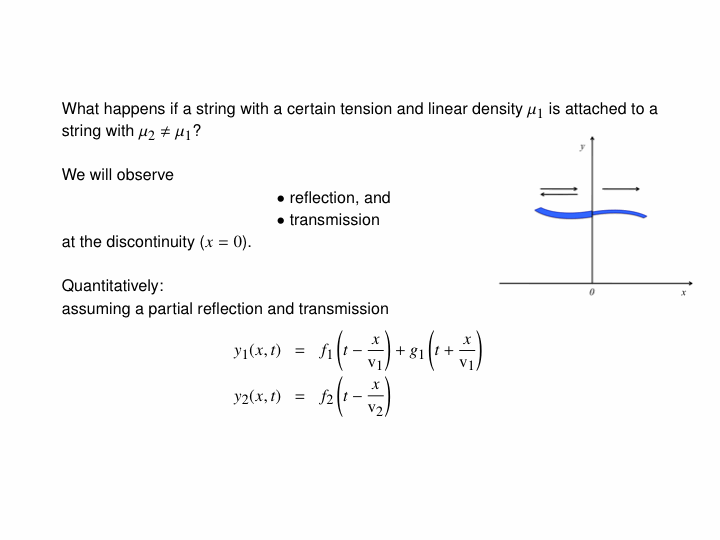
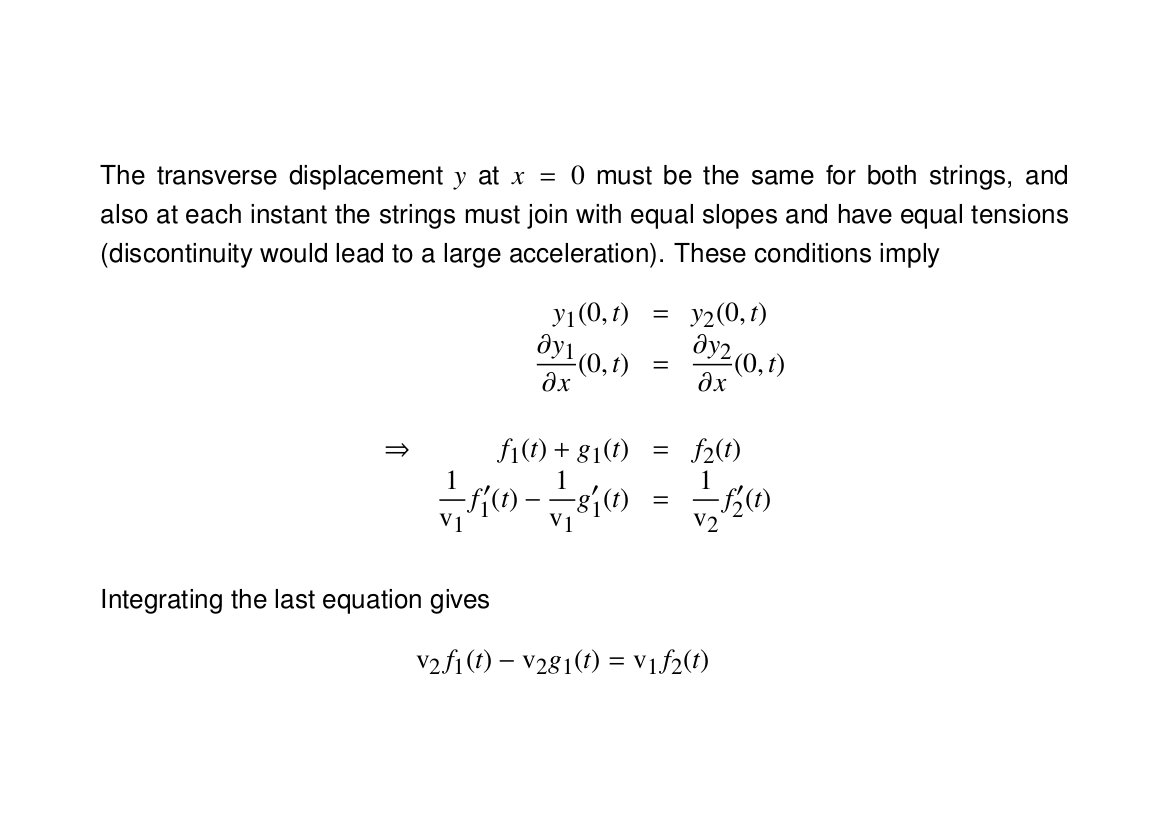
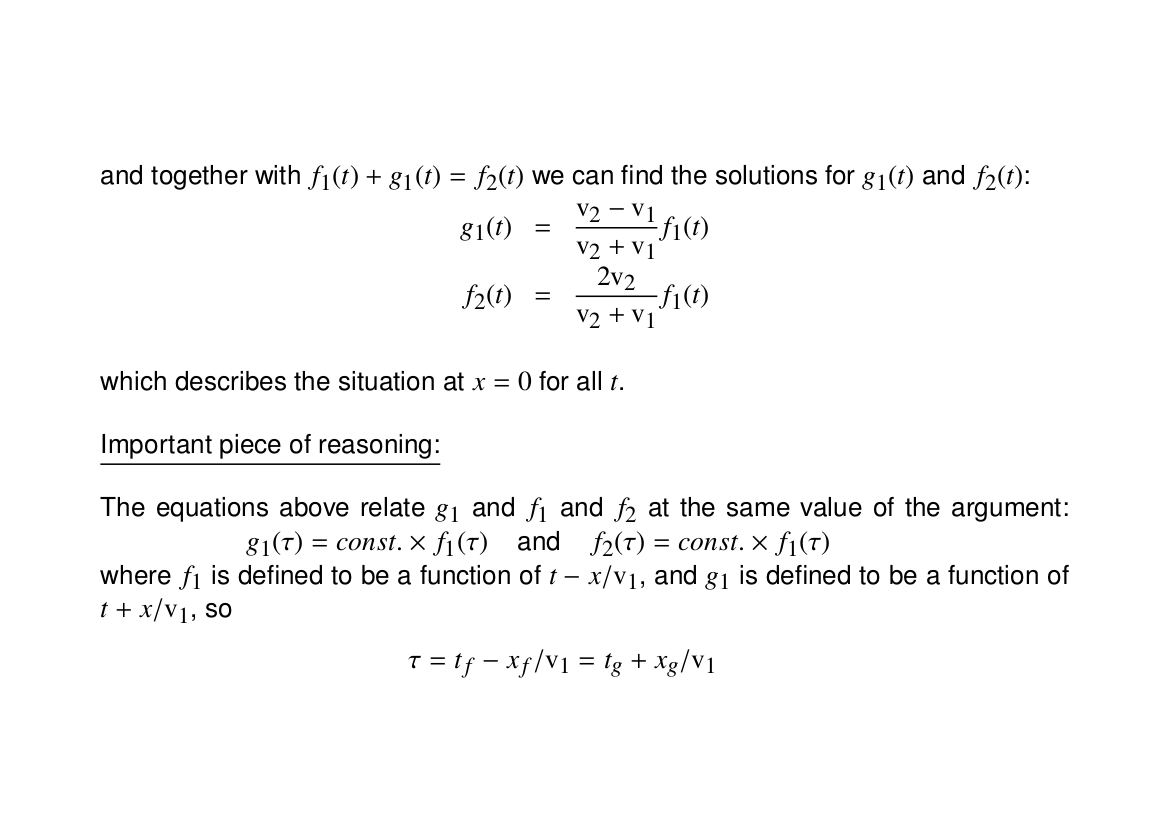
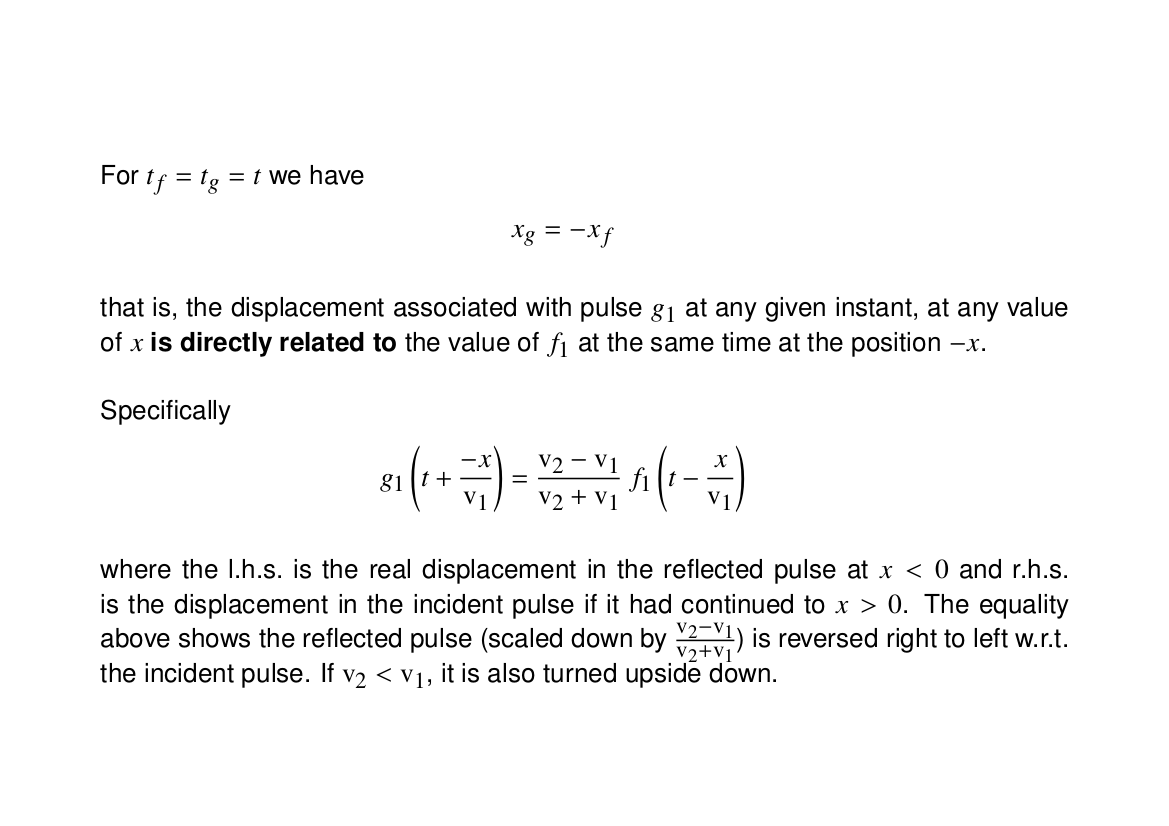
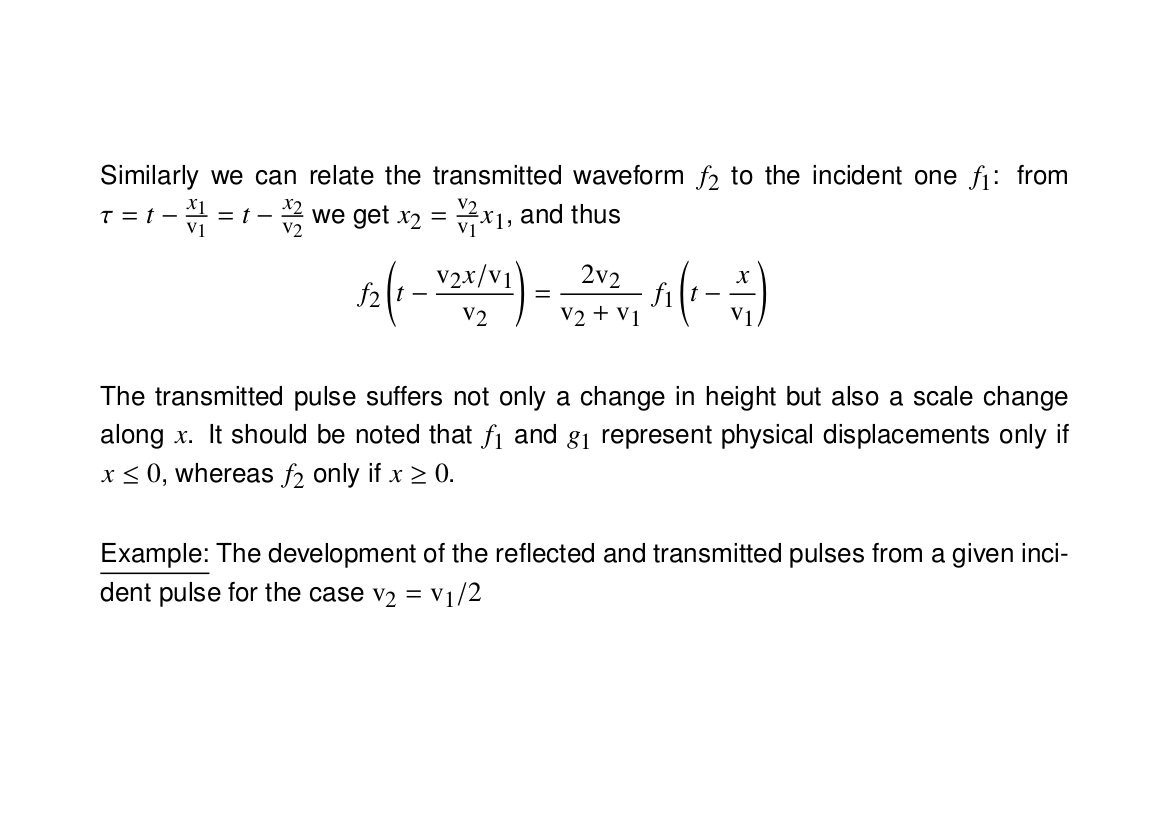
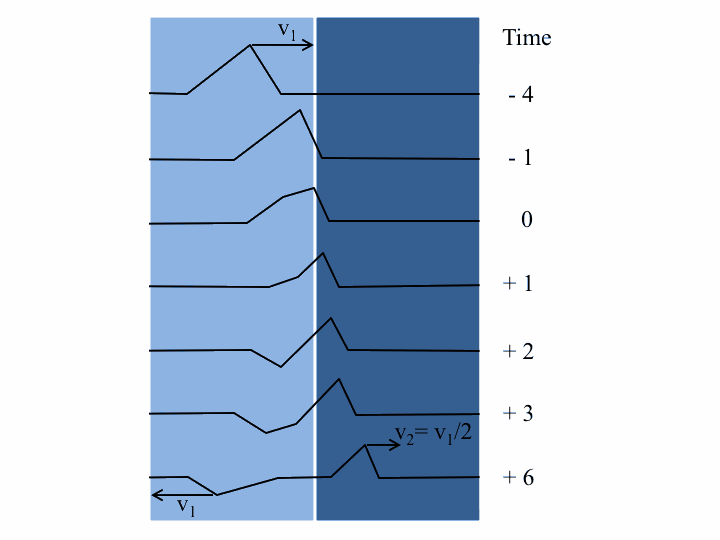
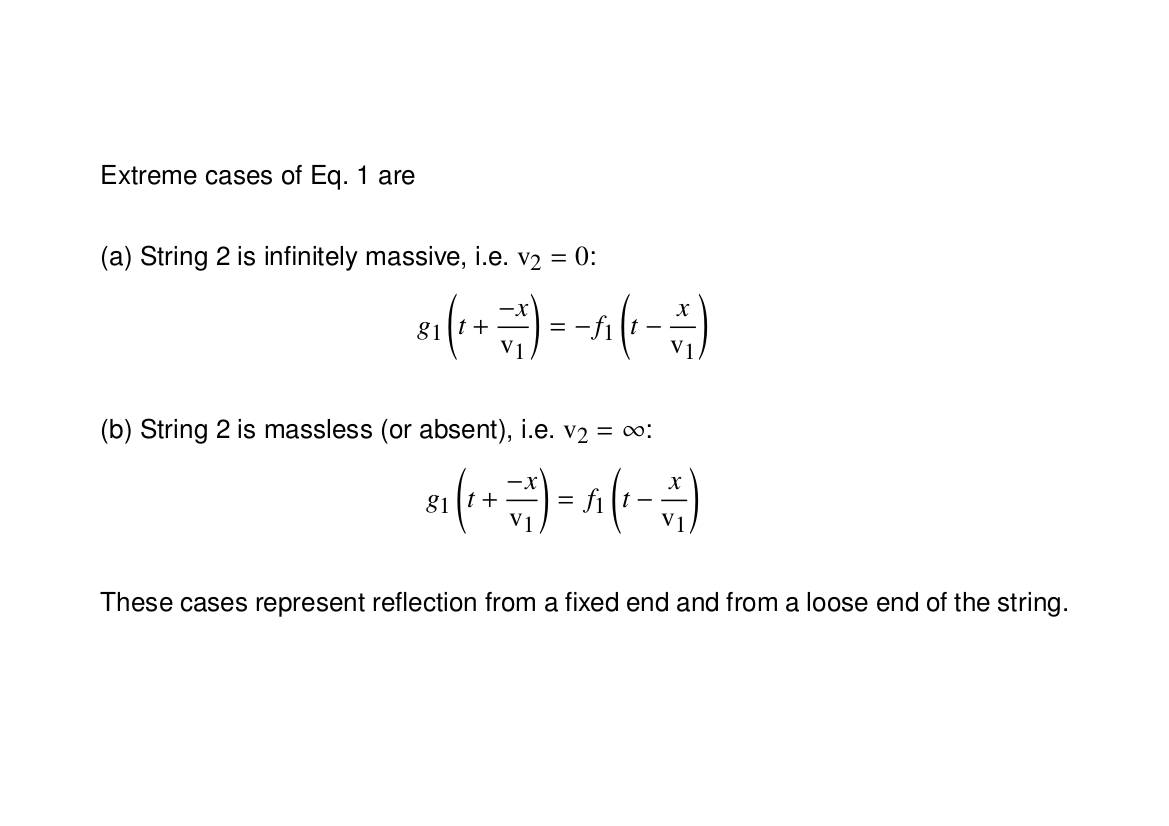
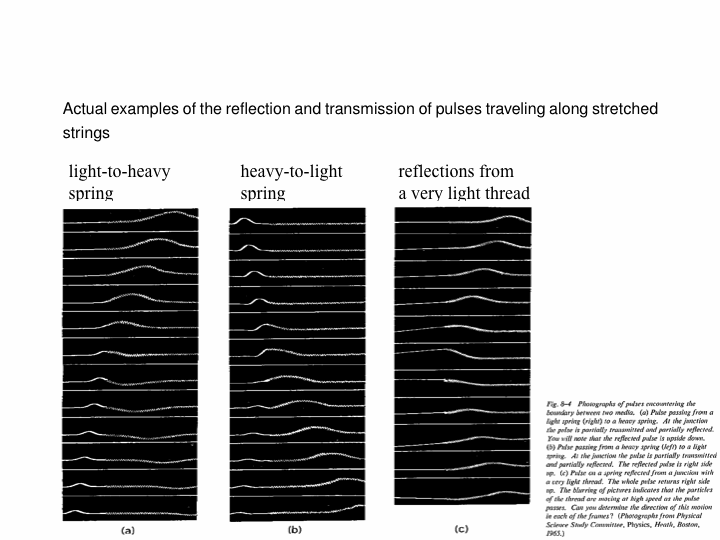
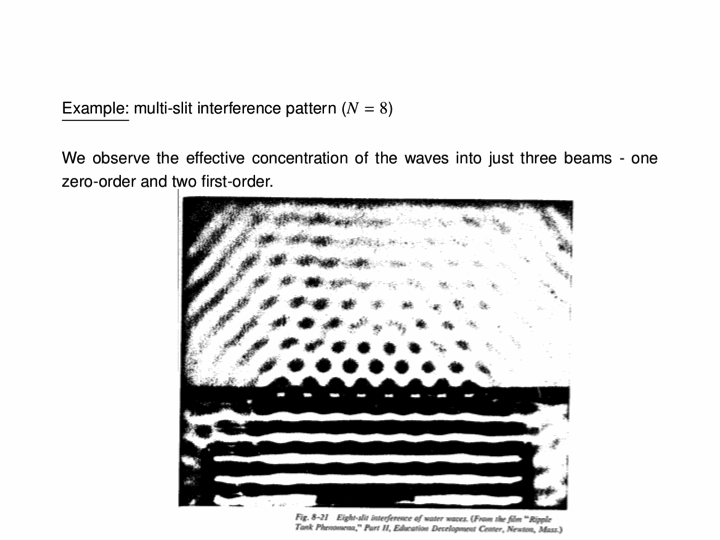
When a travelling wave crosses a boundary between different substances, it will generally split into a reflected portion and a transmitted portion. For example, in the below animations, a wave pulse (a sinusoidal one first, then a Gaussian one) travels along a string whose mass density changes in the middle. In the two leftmost animations, the blue part is four times as dense as the red, and in the rightmost one, the blue is one-quarter as dense as the red:


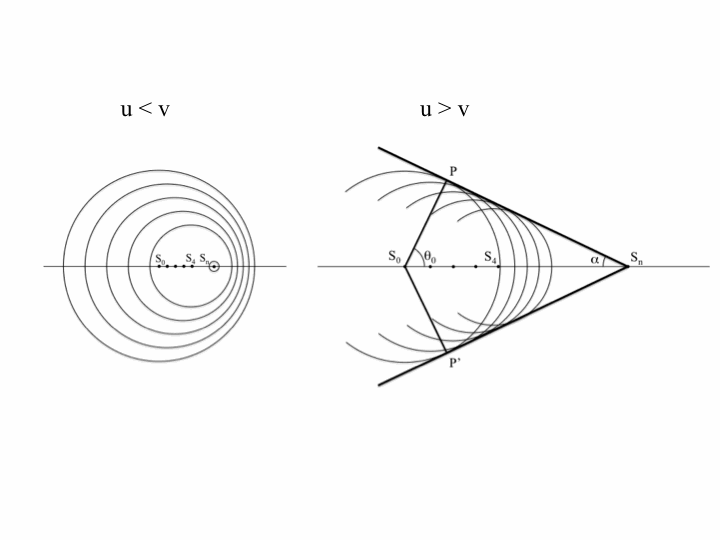
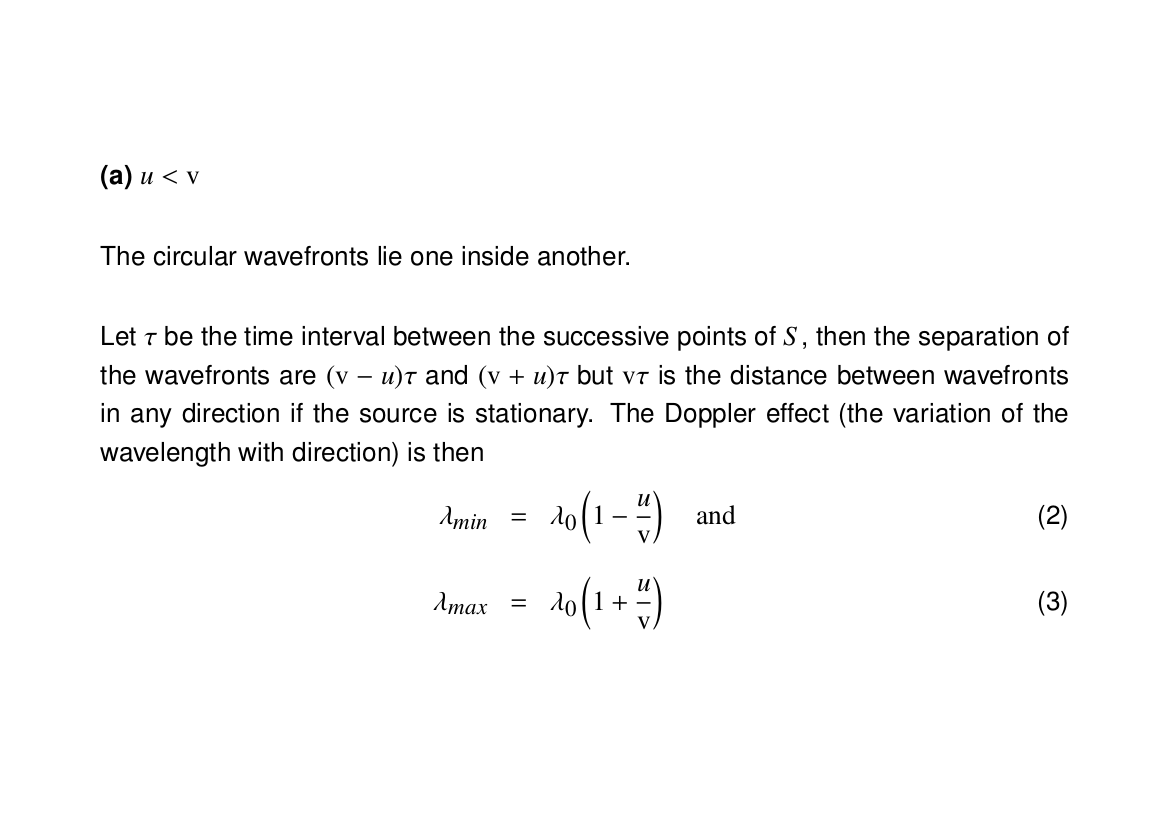
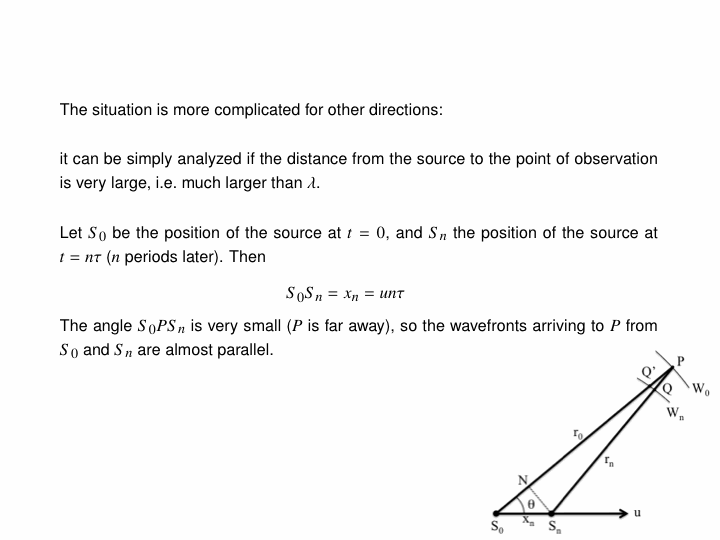
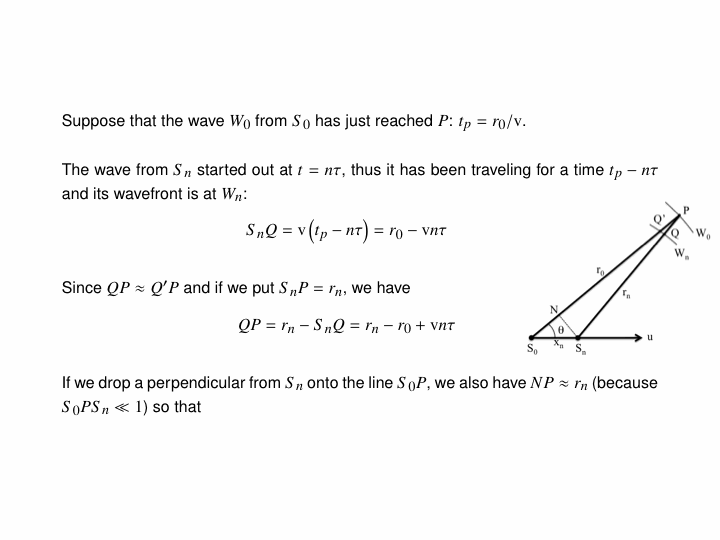
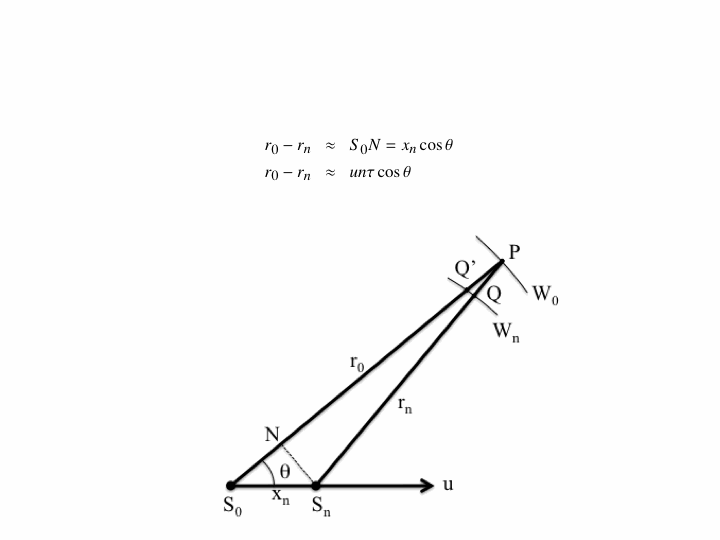
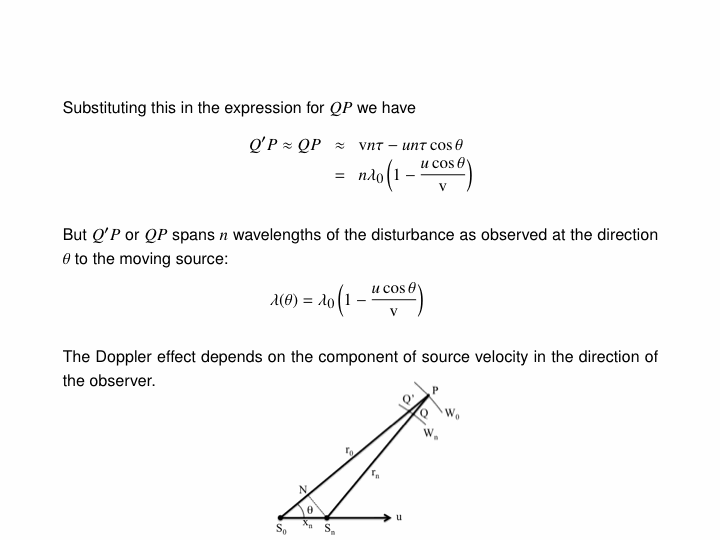
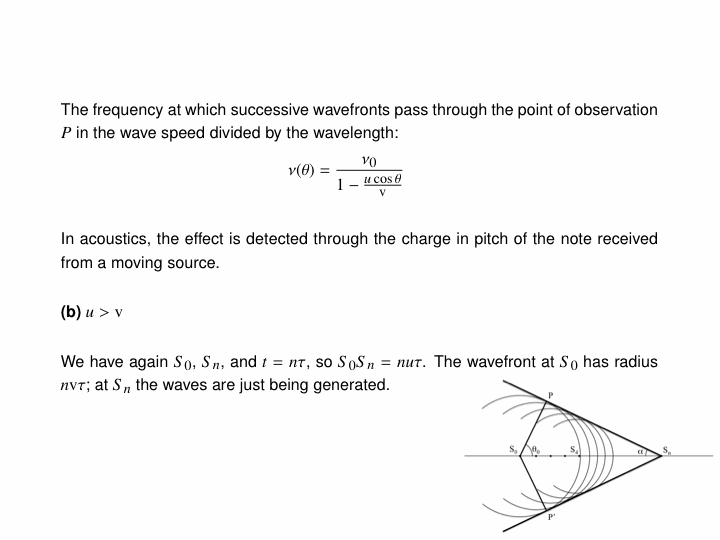
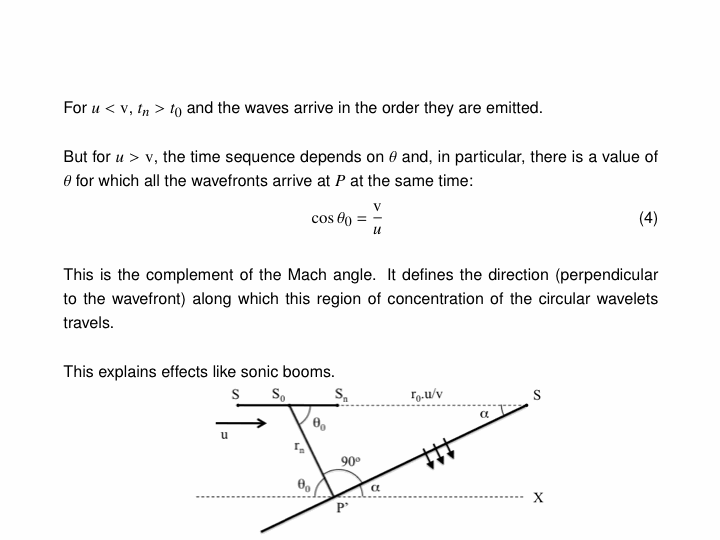
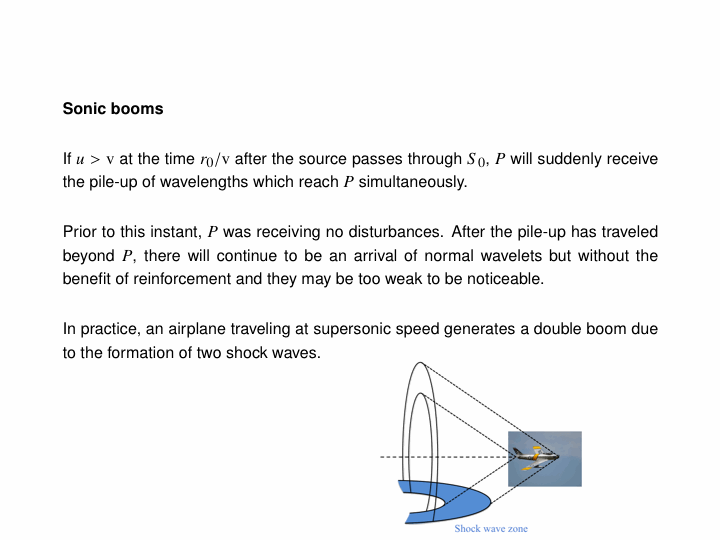
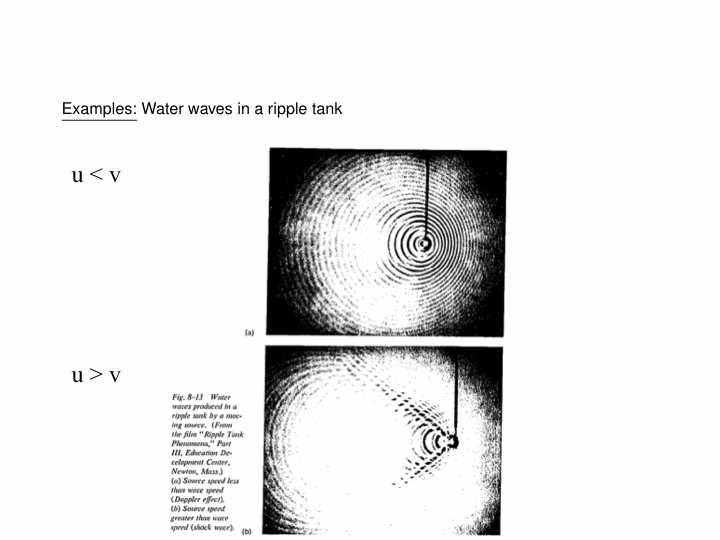
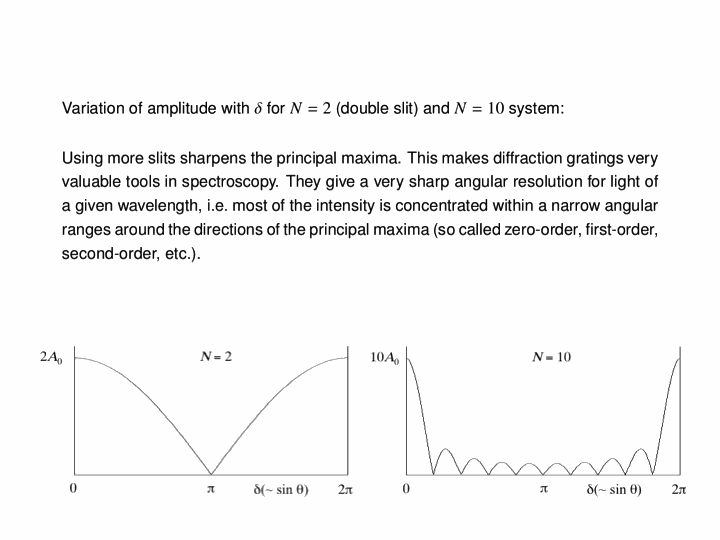
The Doppler effect is due to waves of a fixed frequency being emitted by a moving object. This phenomenon is what causes the characteristic change in pitch of train whistles as they pass by, but also manifests itself in the sonic boom created by a plane when it breaks the sound barrier. To illustrate this, below is an animation of a transponder emitting waves as it travels at half the wave speed (i.e. subsonic, Mach 0.5):
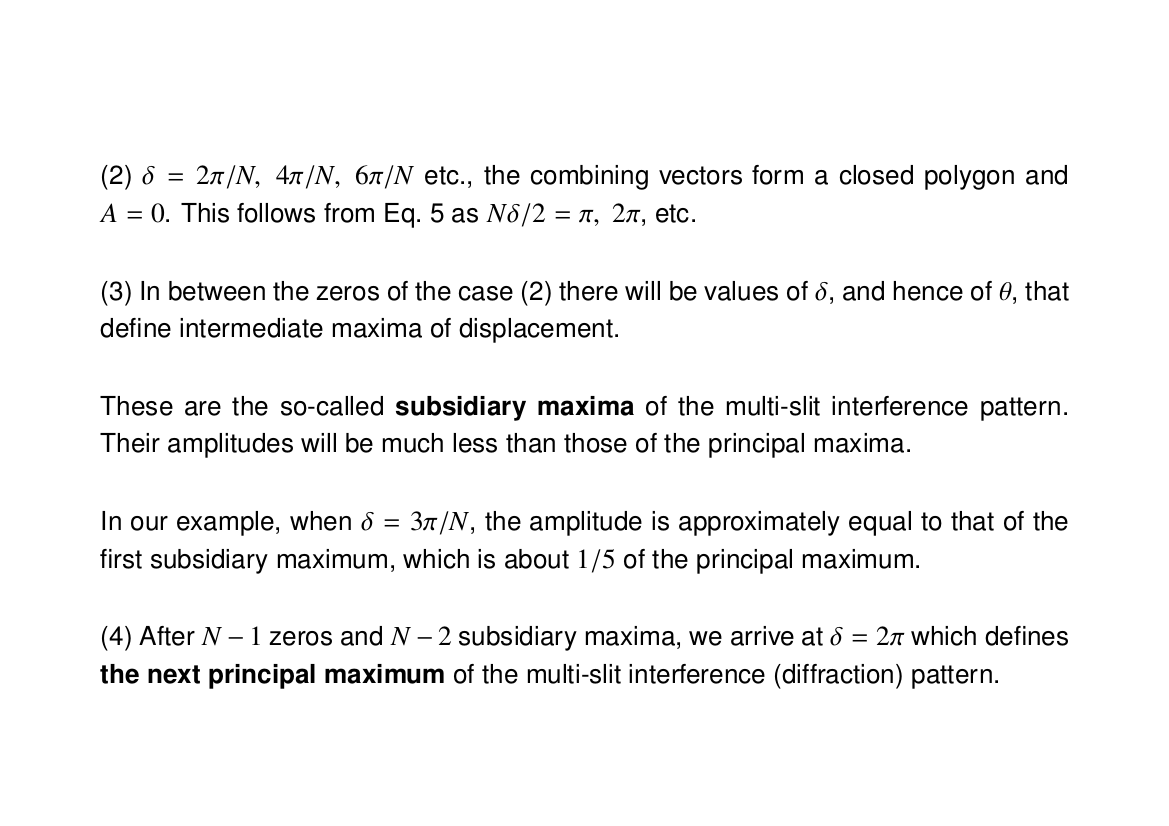
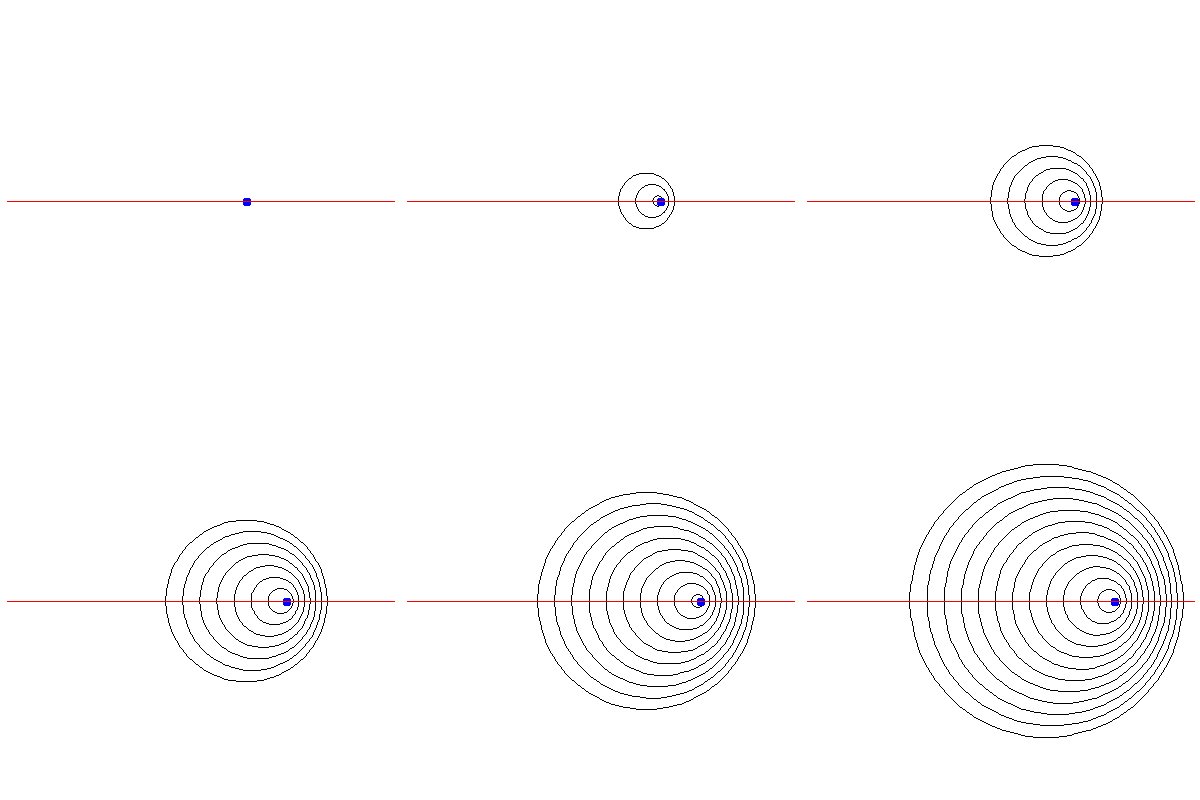 Note that the wavefronts are all bunched up in front of the emitter and stretched out behind it; thus, to a stationary listener, the wavelength of the emitted signal is shortened in front of the transponder (higher pitch) and lengthened behind it (lower pitch).
Here is an animation where the transponder speed is exactly the same as that of the waves (sonic, Mach 1):
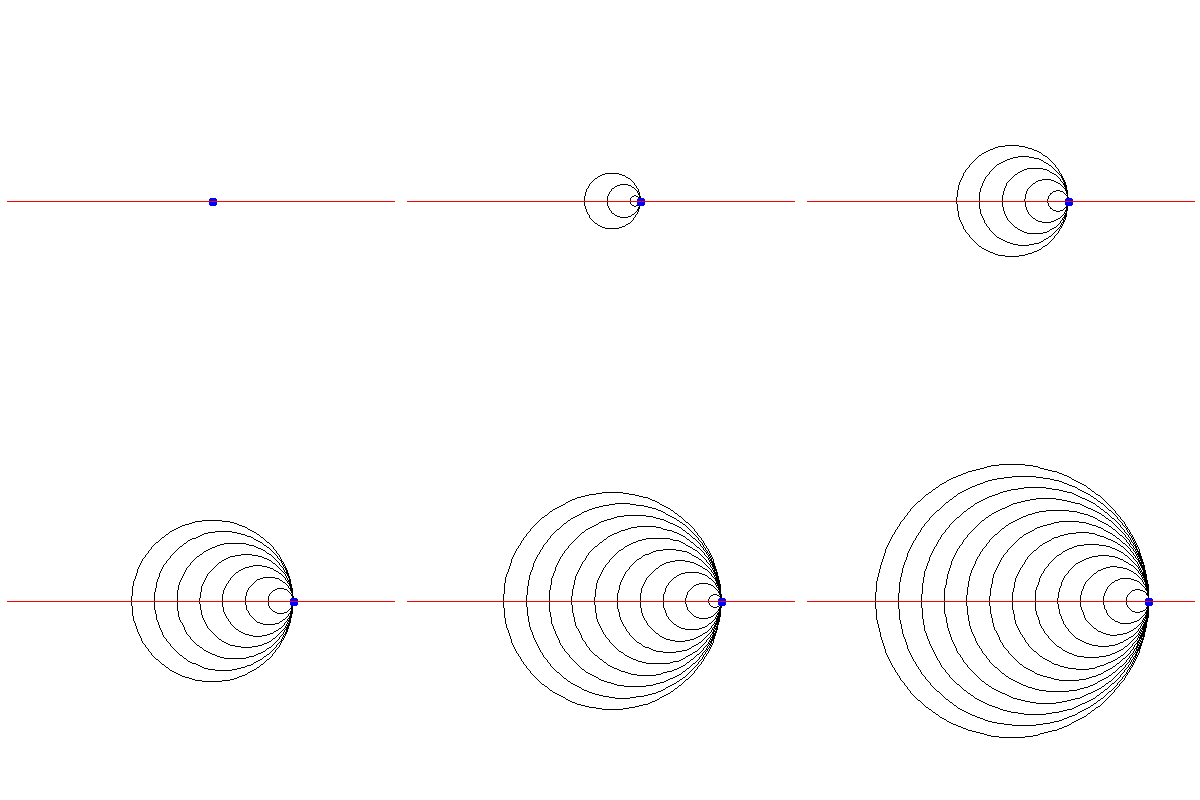
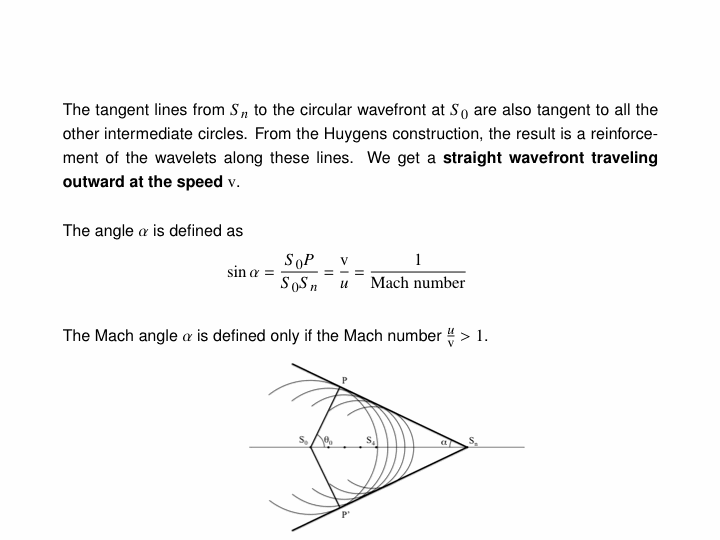
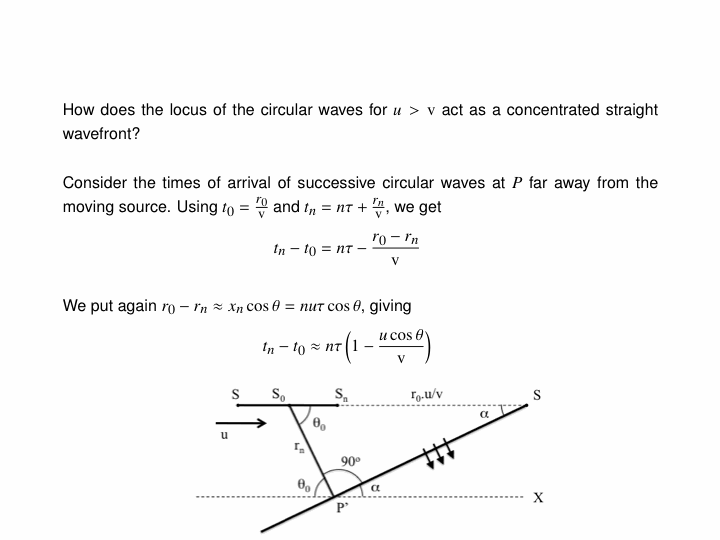
And one where the transponder speed is 1.5 times the wave speed (supersonic, Mach 1.5):
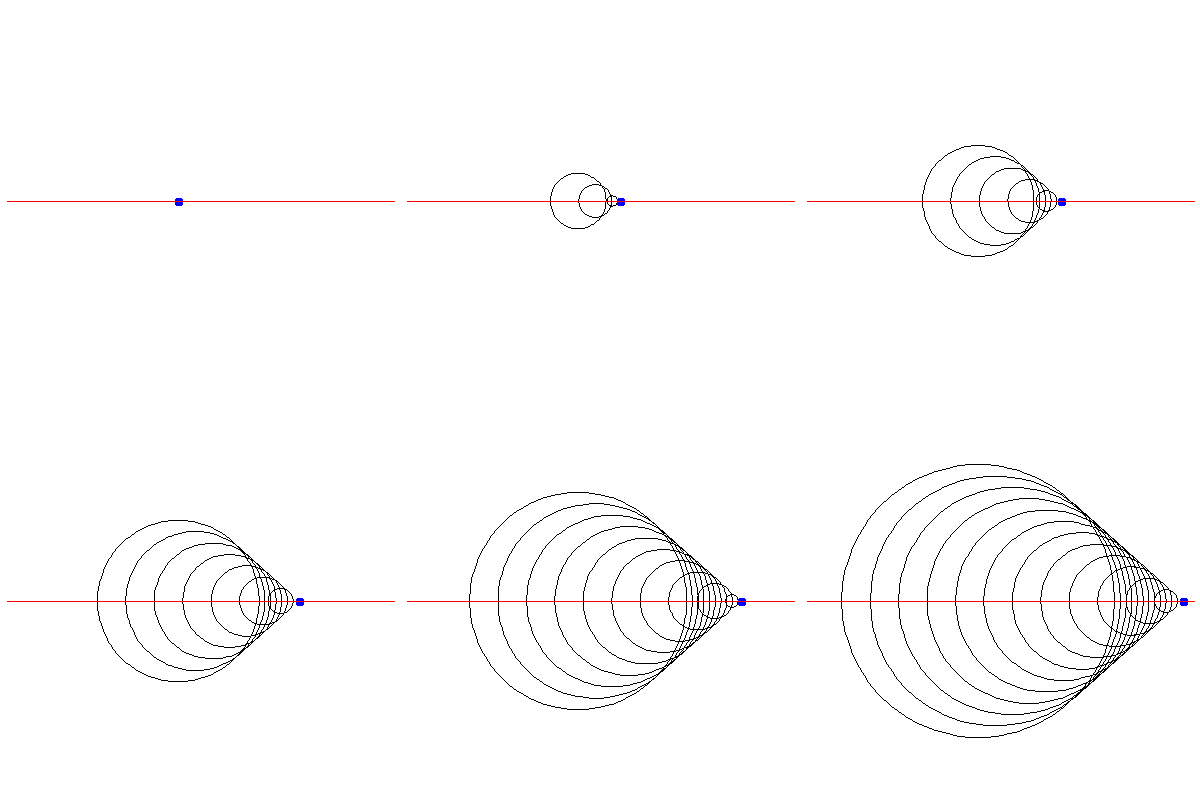 The conical envelope of the wavefronts is responsible for the shock wave you hear as a supersonic plane passes overhead.
All of the following animations depict waves with a frequency of $\omega=2\pi\,\mathrm{rad}\cdot\mathrm{s}^{-1}$, with this one showing such a wave emanating from a single point source:
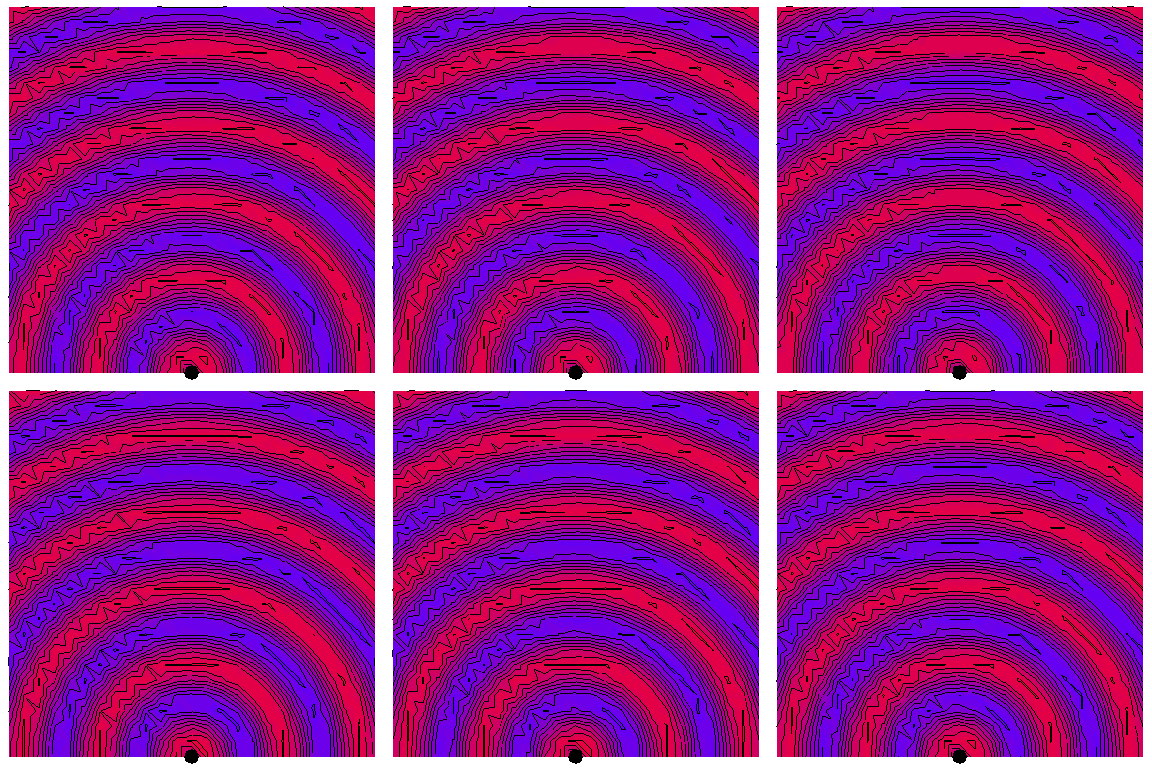 The red regions are the peaks of the wave and the blue region the troughs, with the wavelength being the distance between successive peaks or troughs. The purple regions are where the total amplitude is zero or very small.
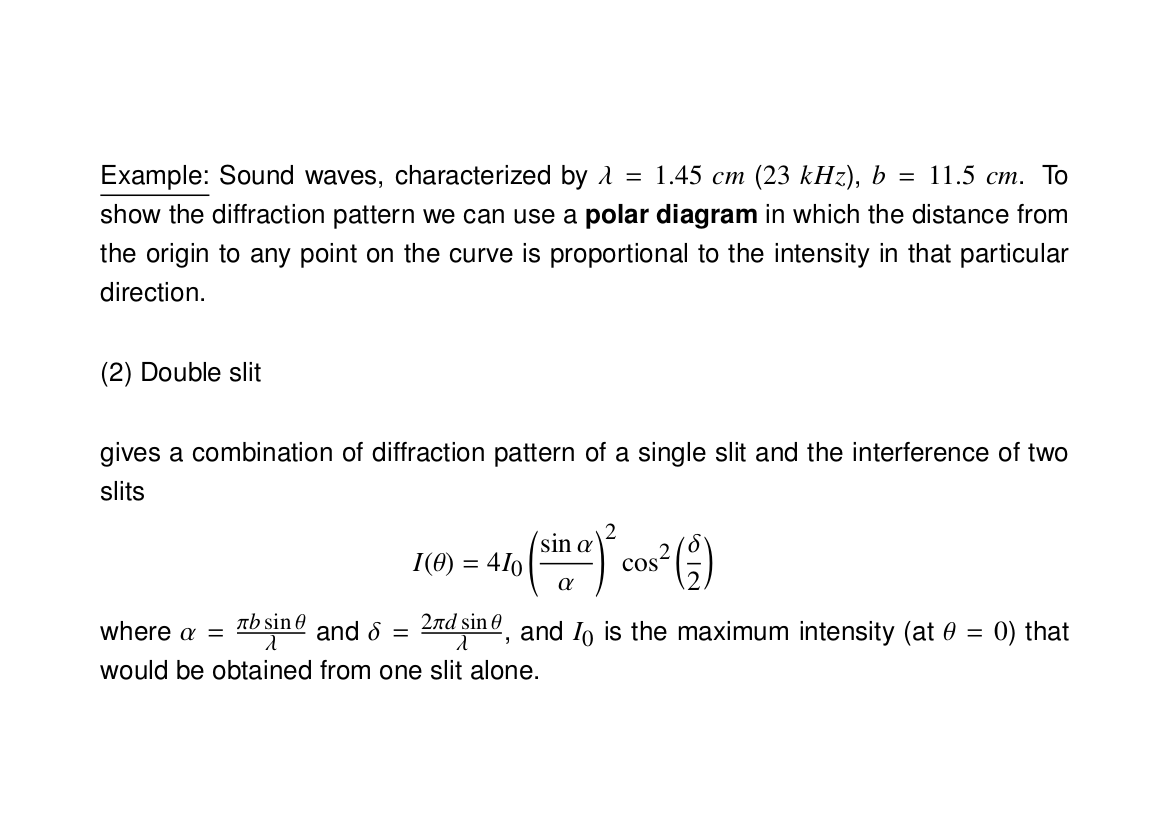
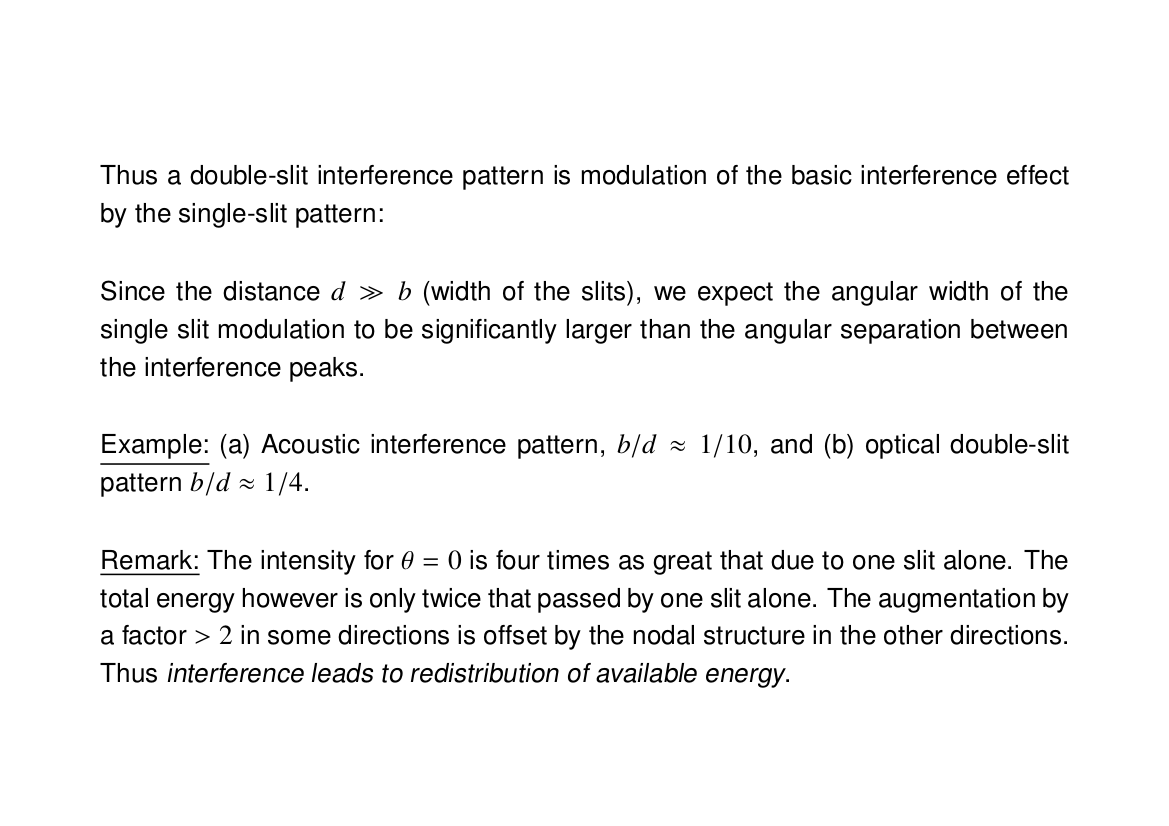
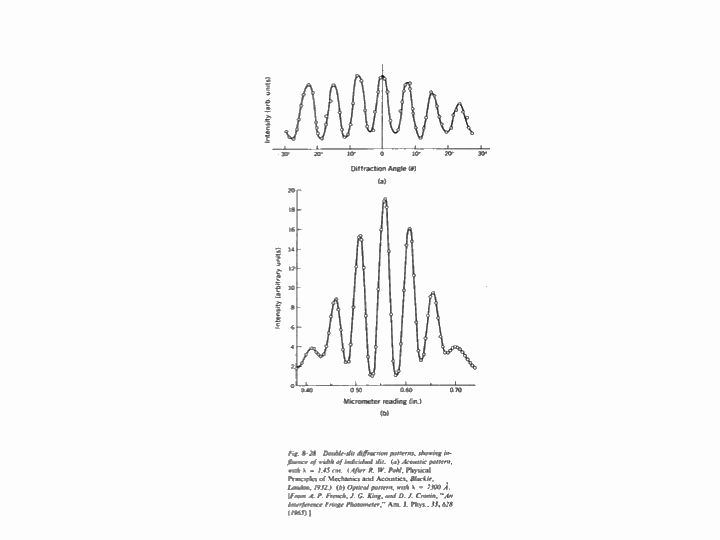
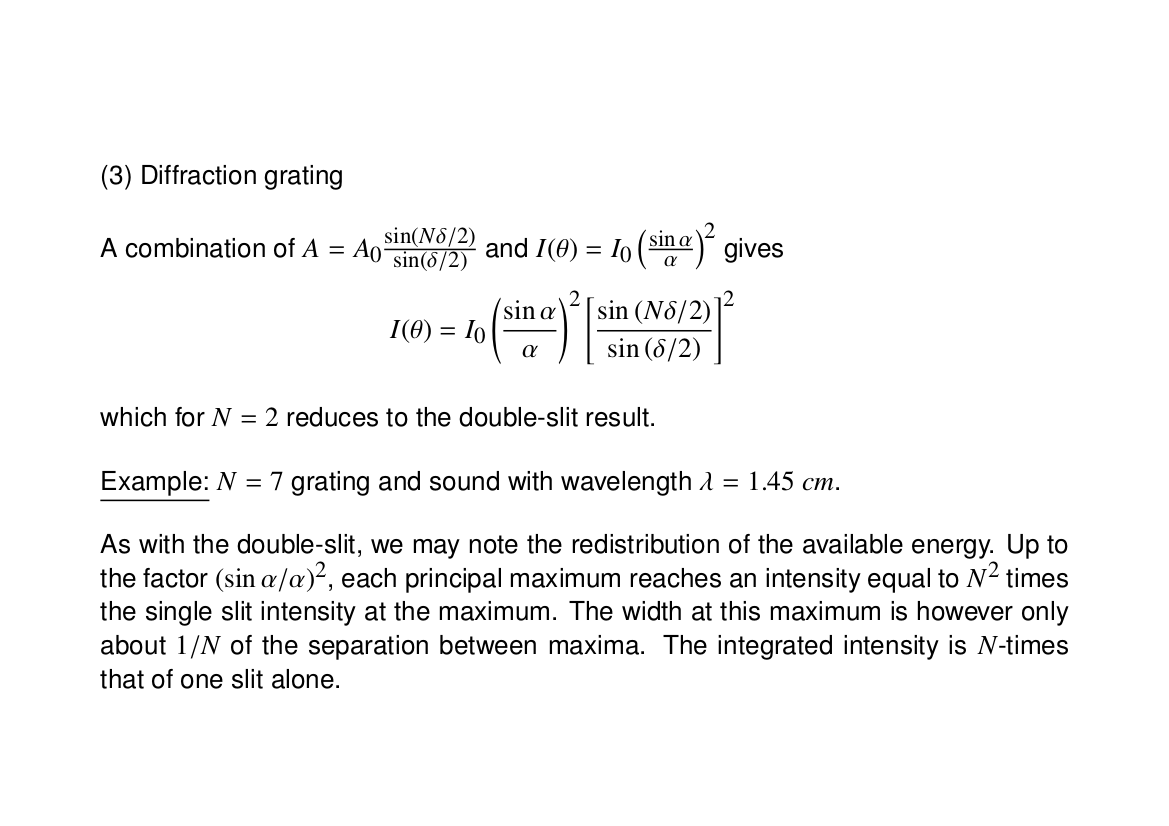
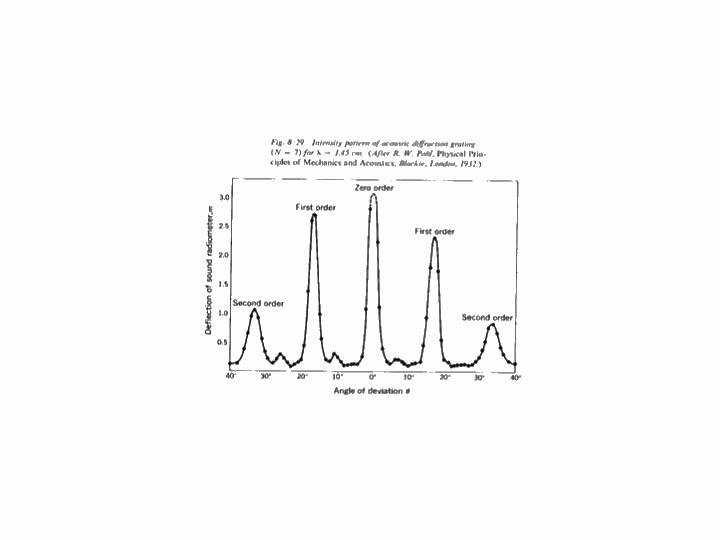
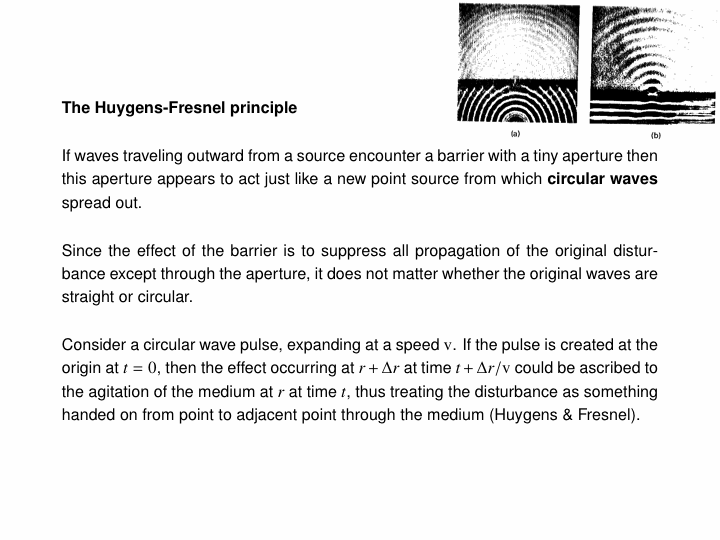
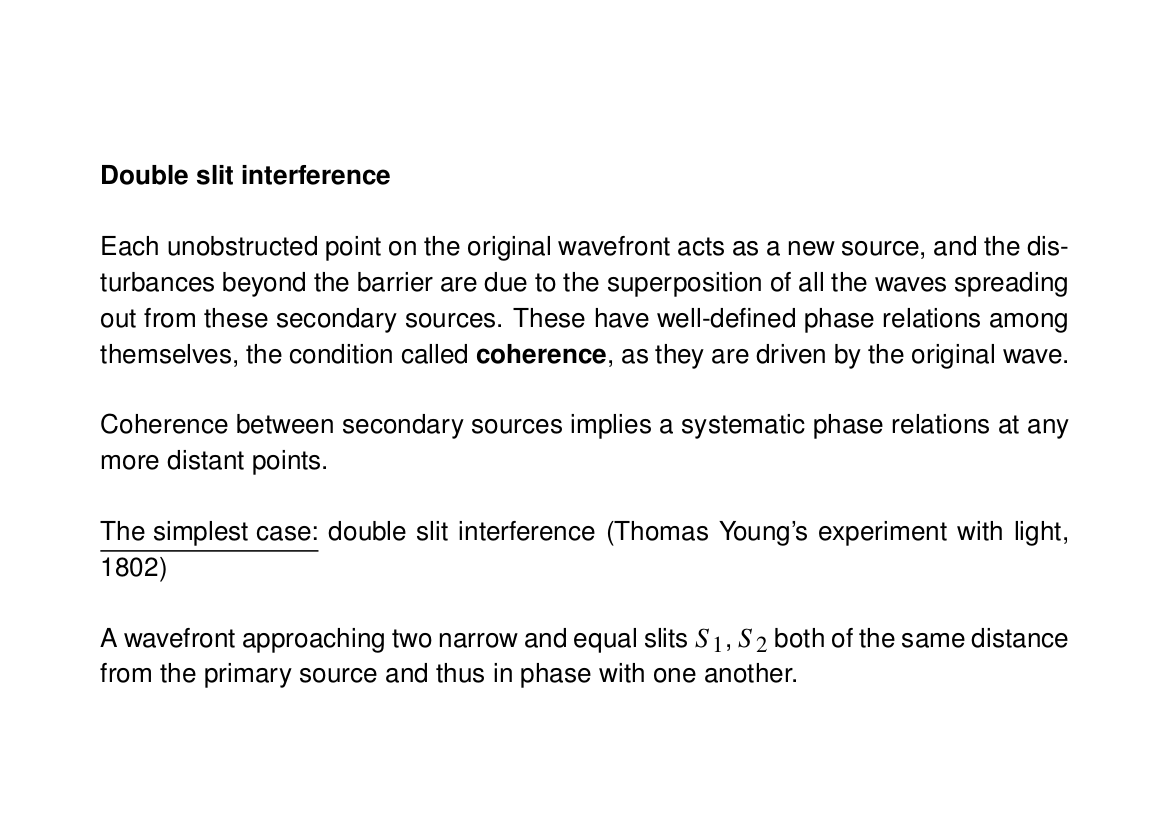
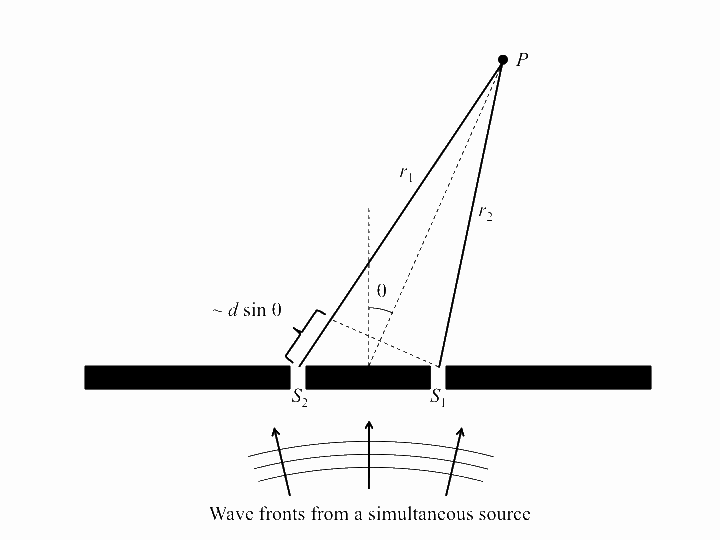
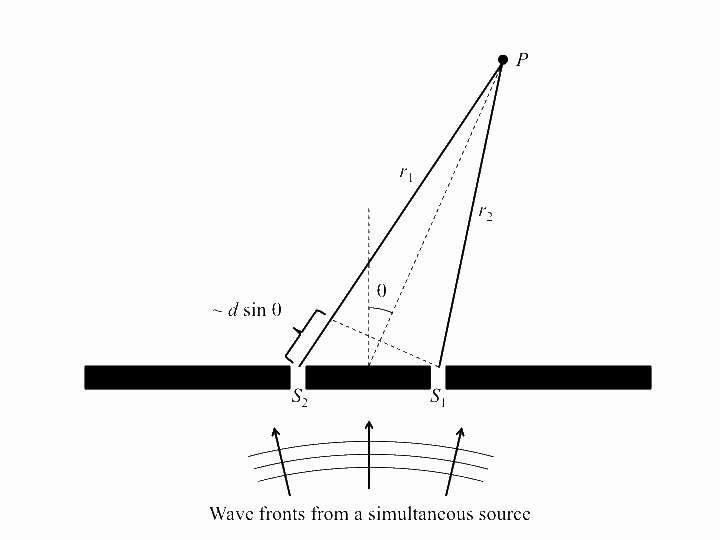
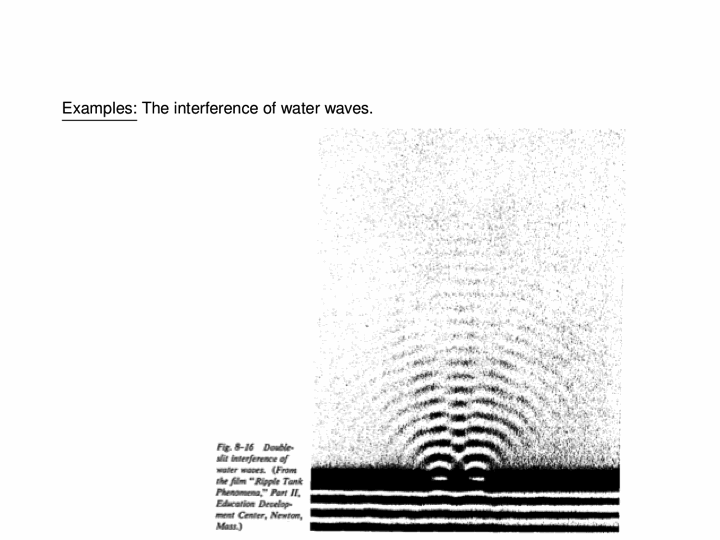
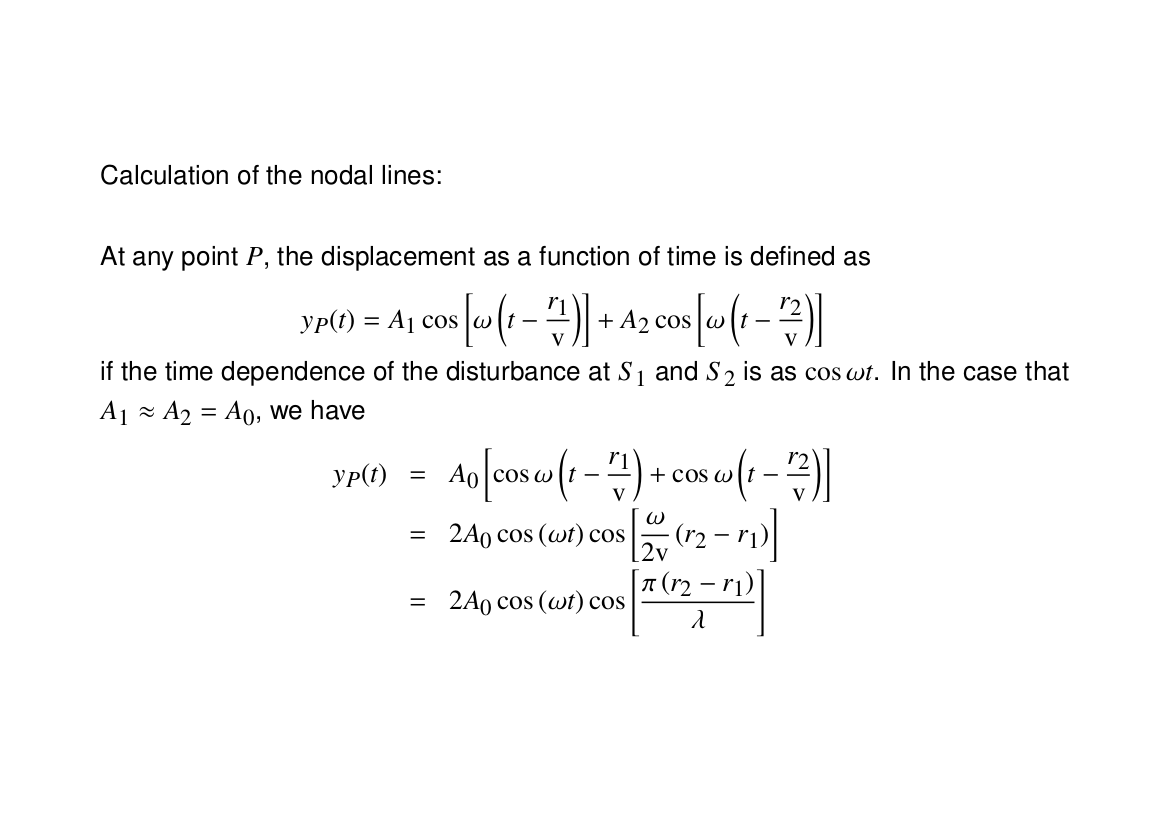
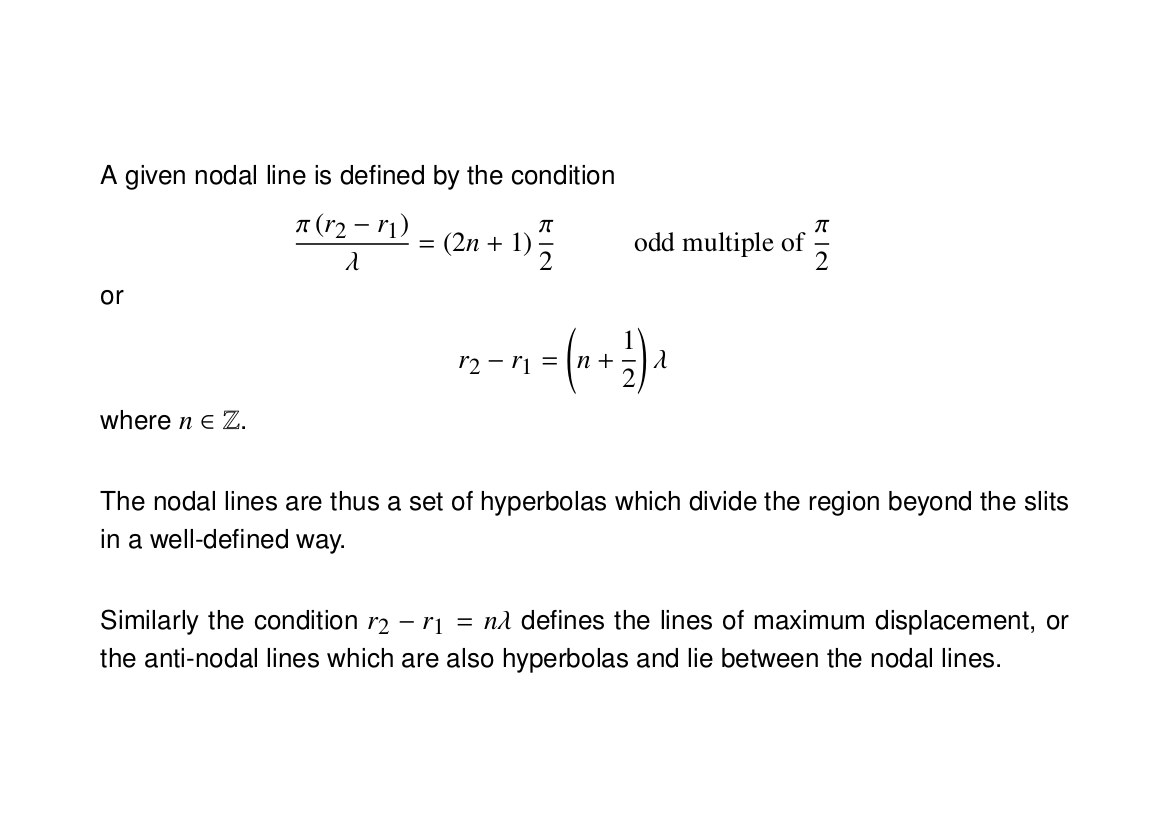
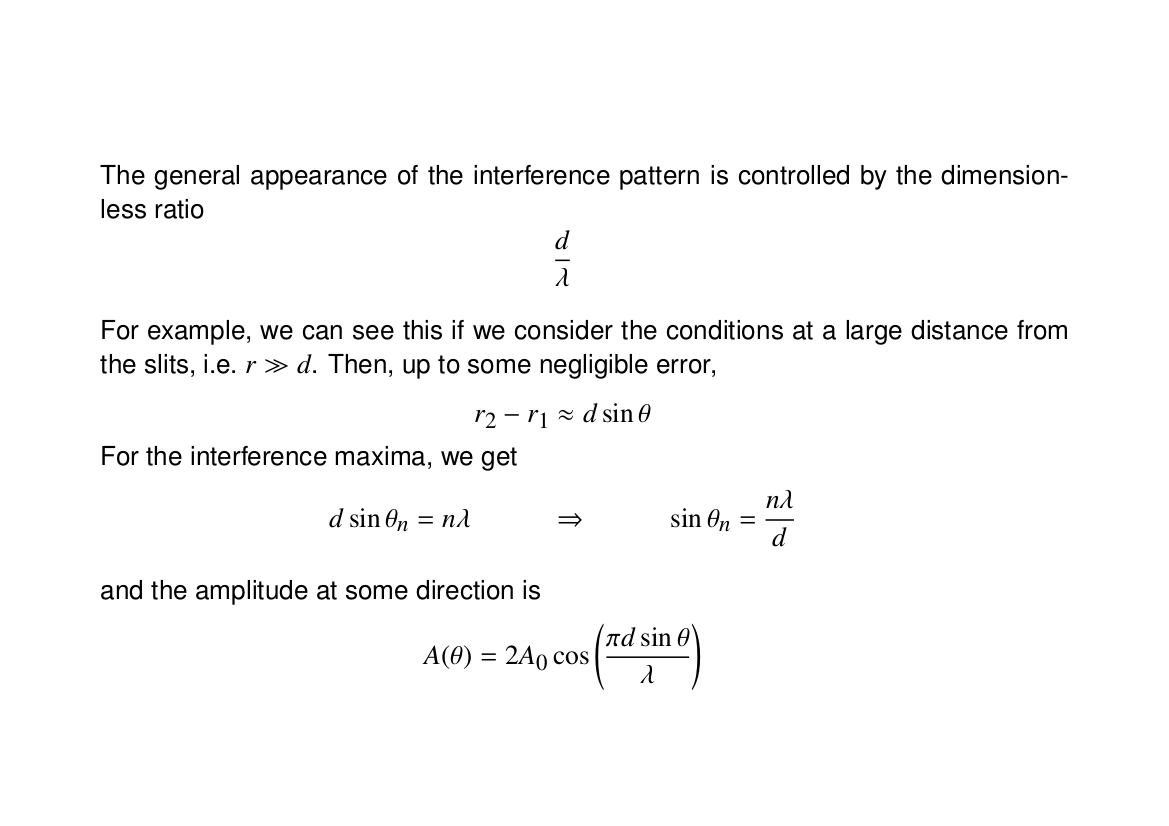
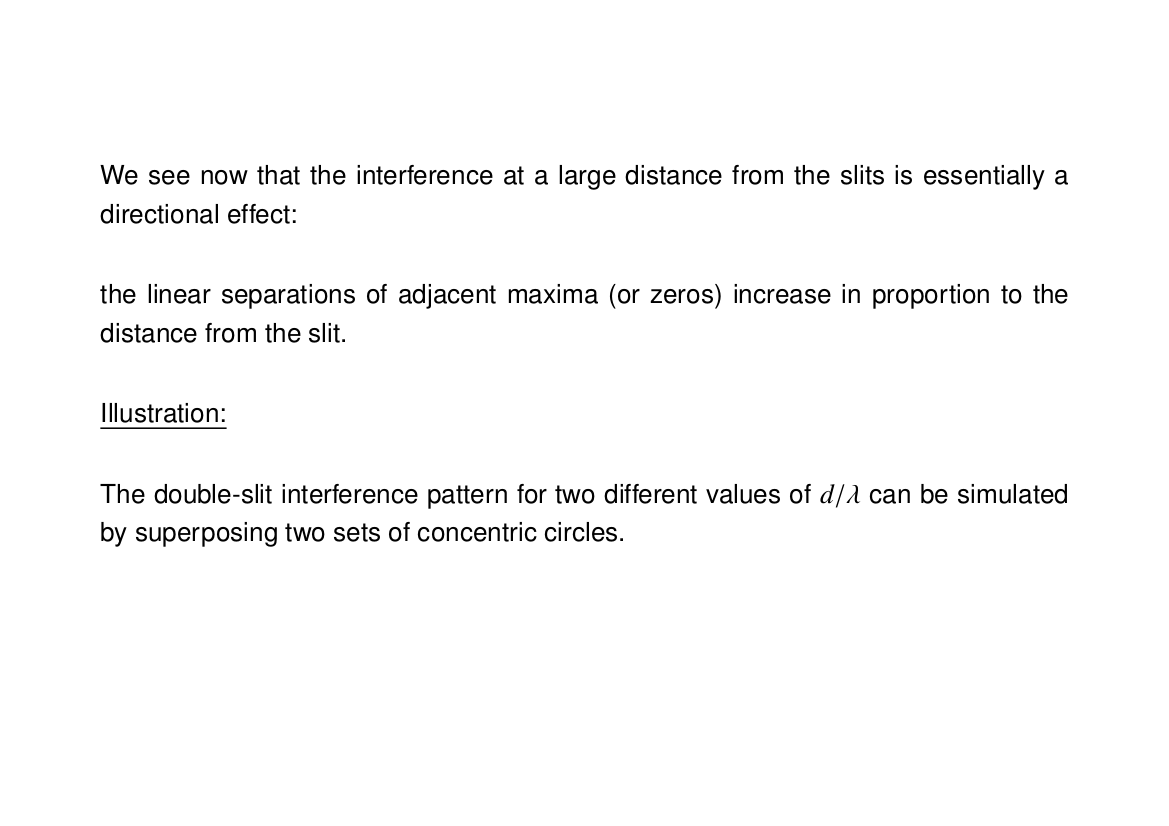
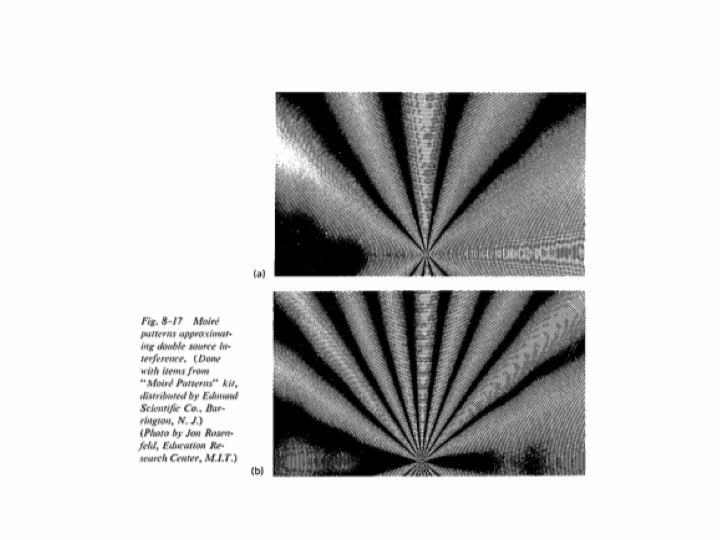
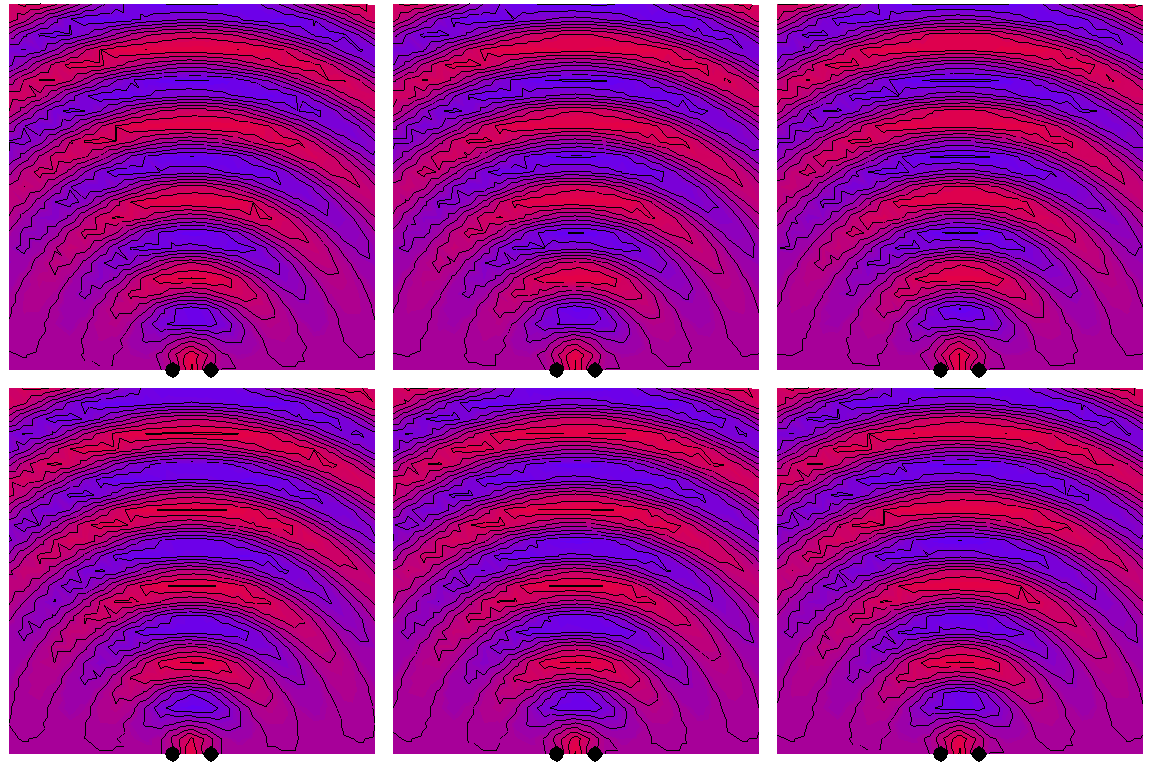
Now we look at the case of two point sources (which is a way of modelling a plane wave normally incident on a wall with two very thin slits in it), with the four following animations depicting the interference patterns when the sources are separated by, respectively, half a wavelength, one wavelength, two wavelengths and three wavelengths:
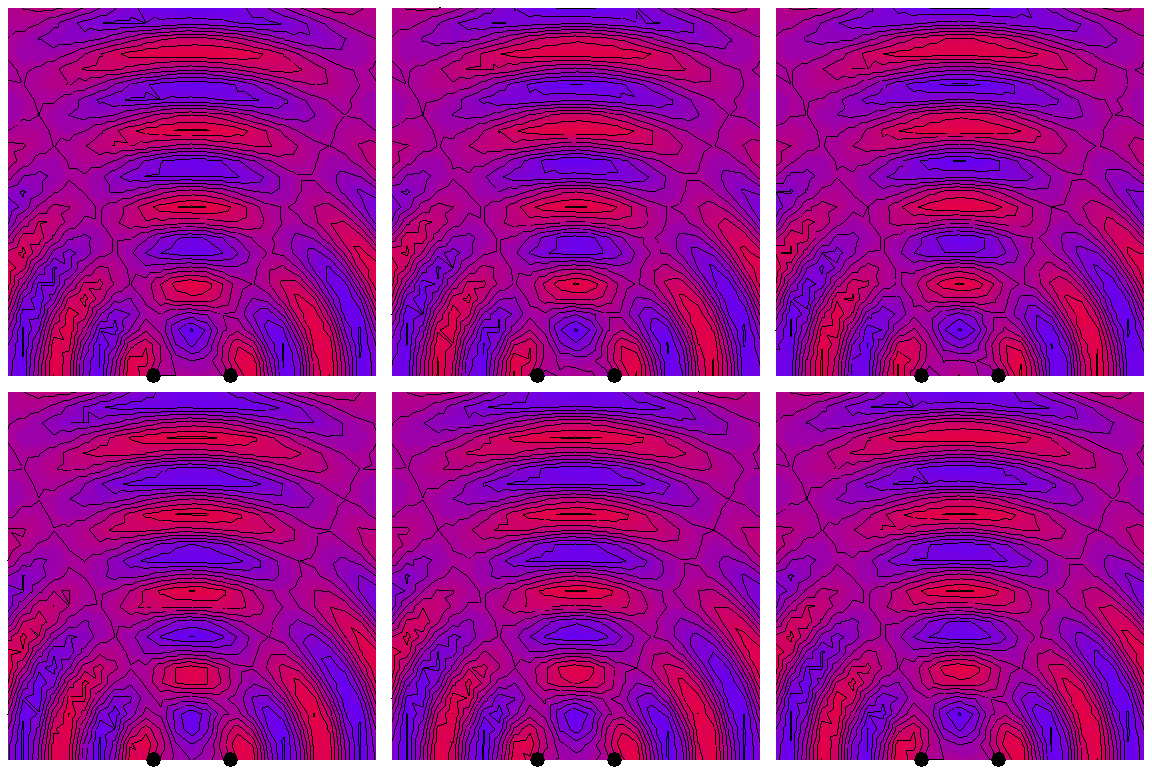
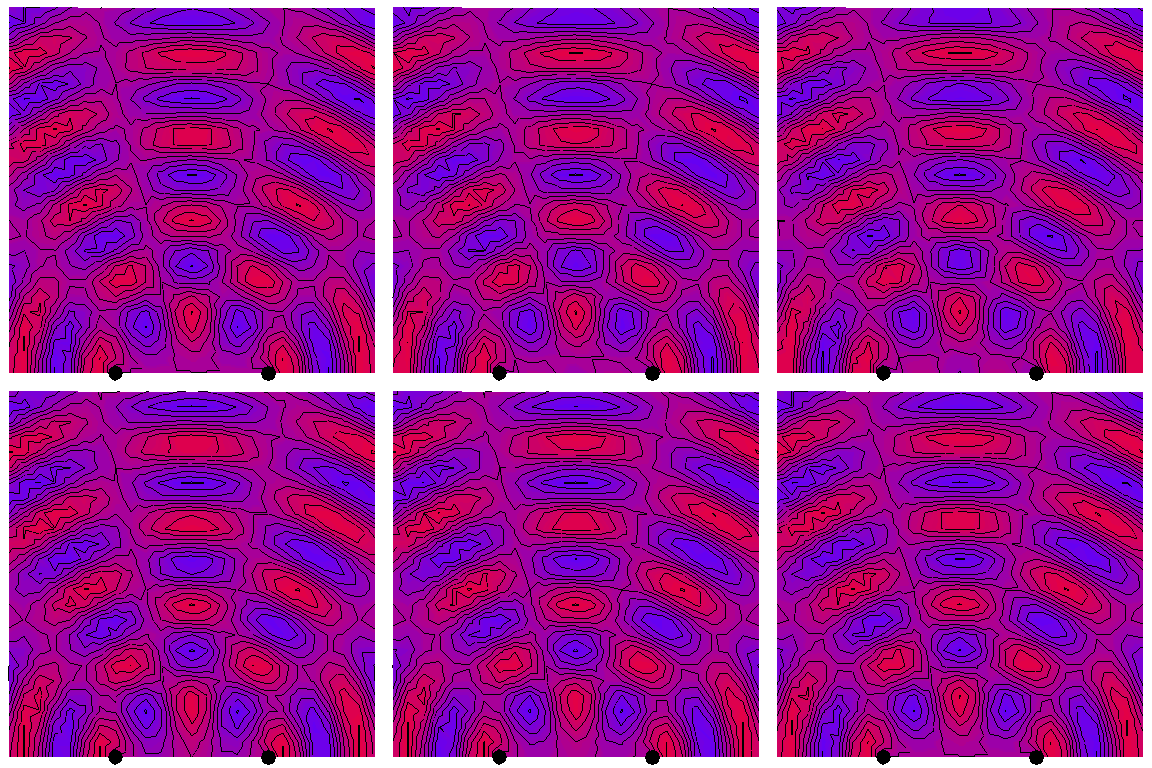
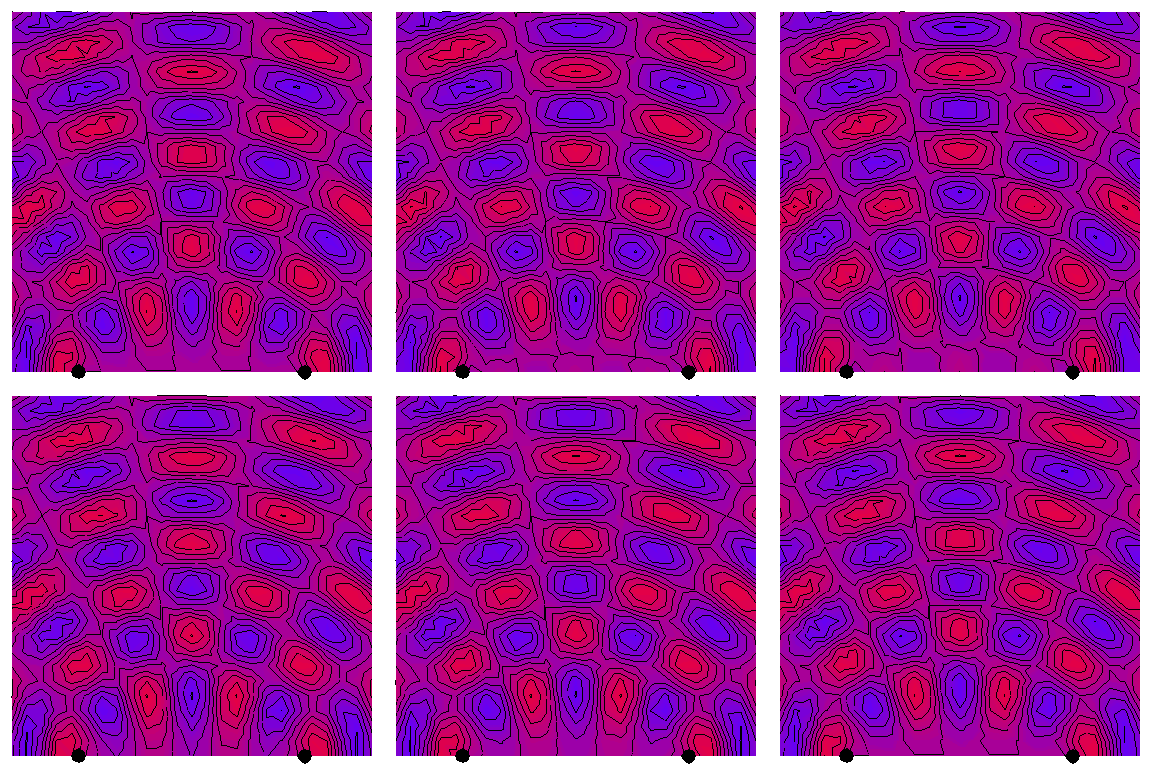
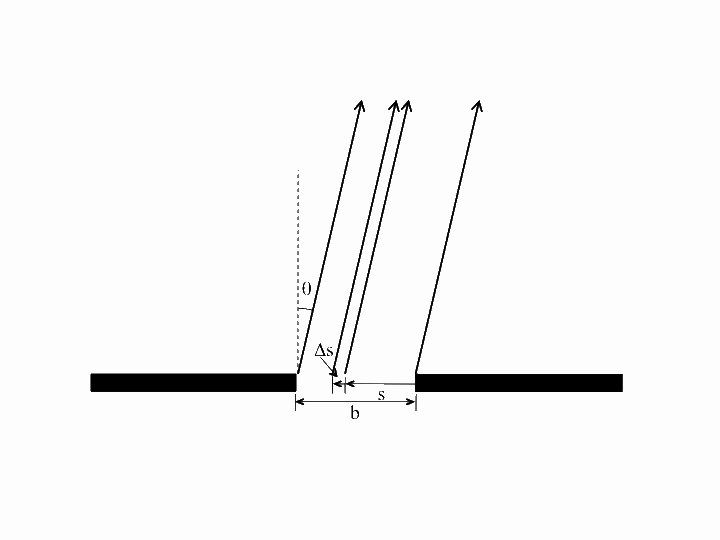
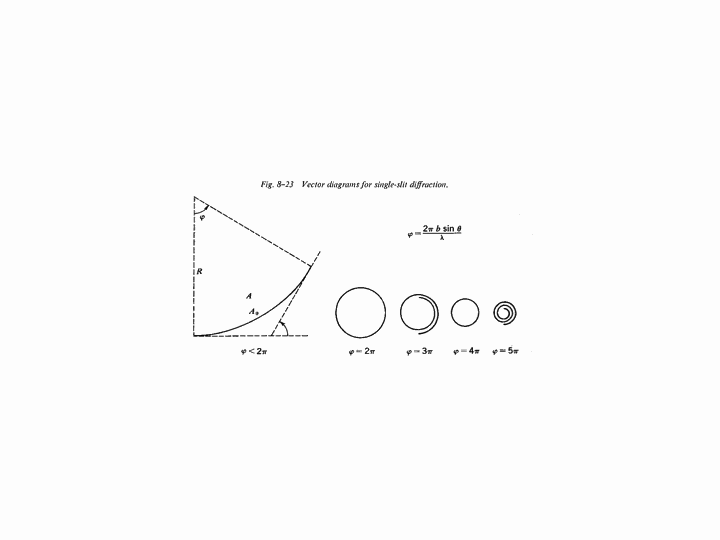
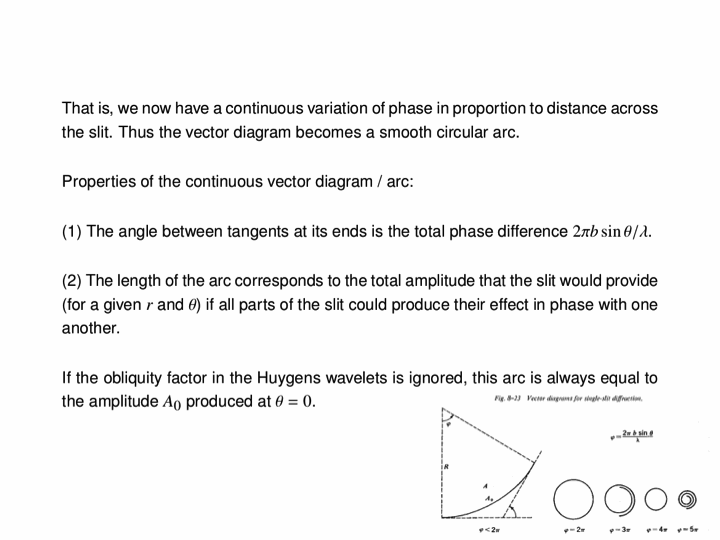
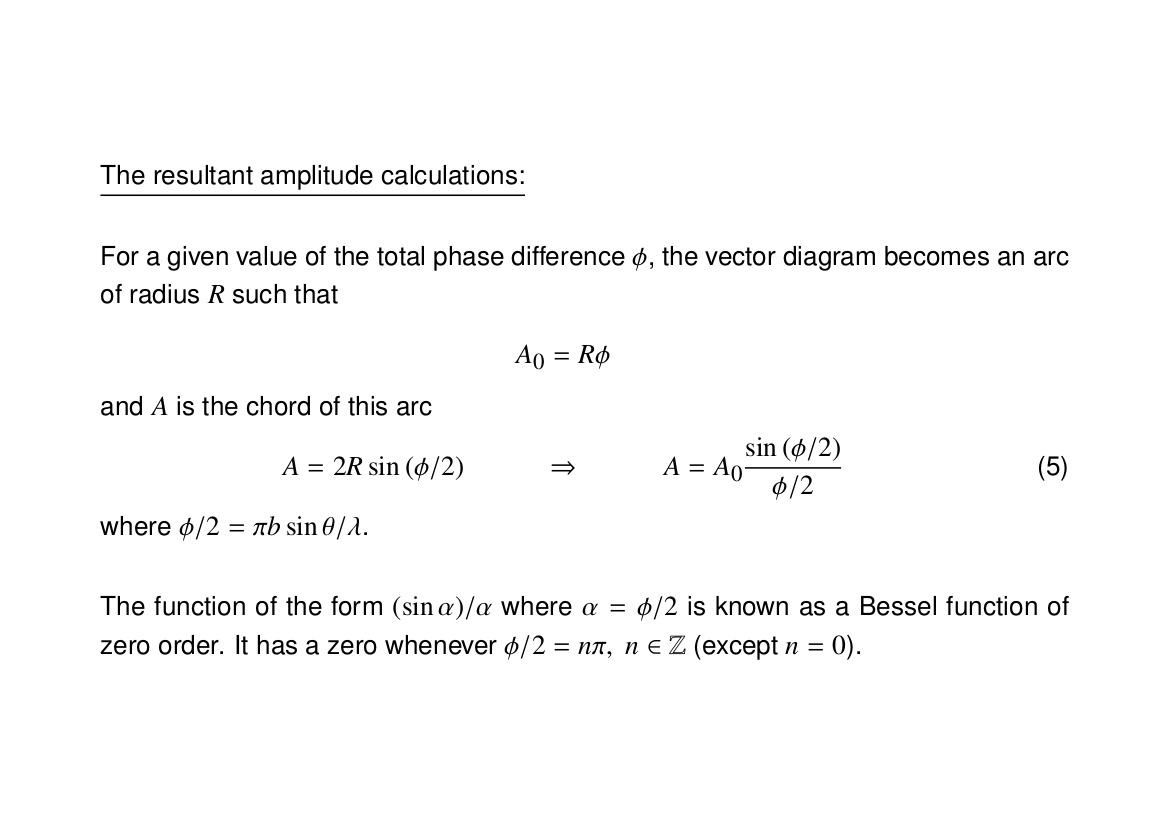
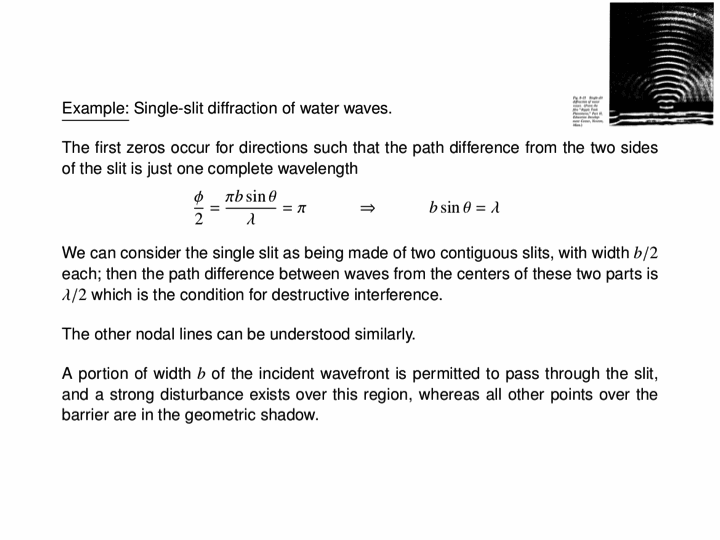
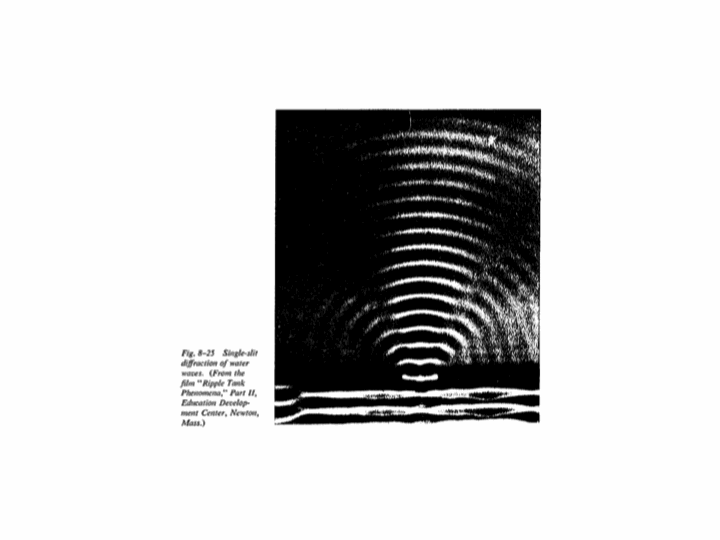
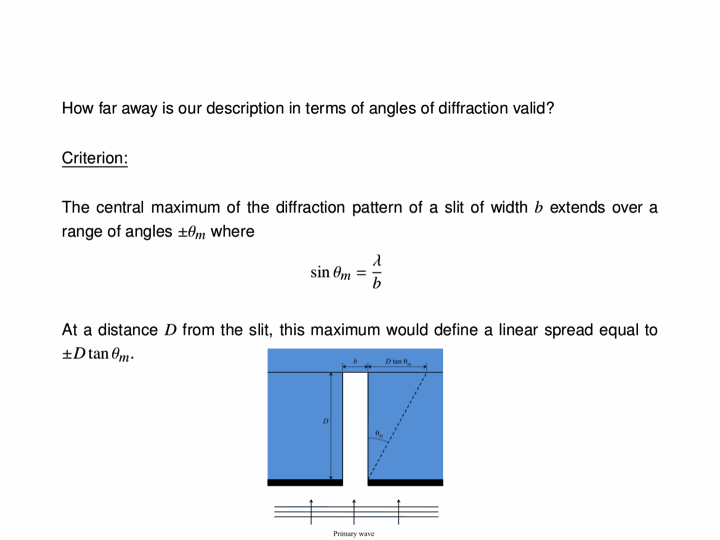
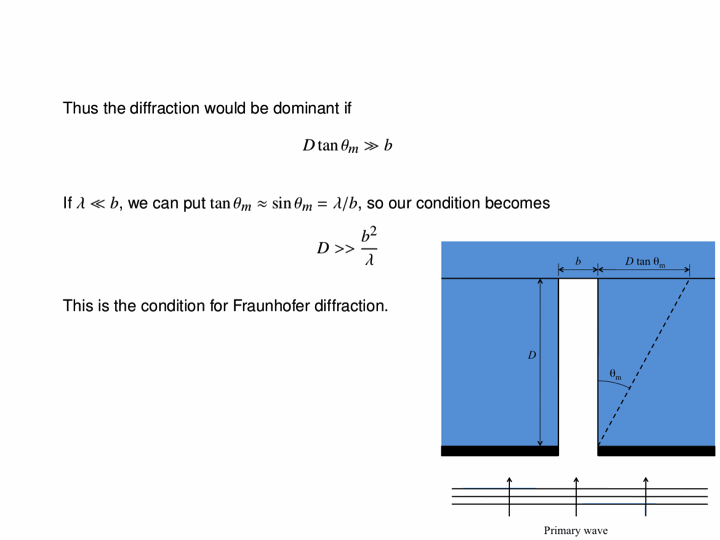
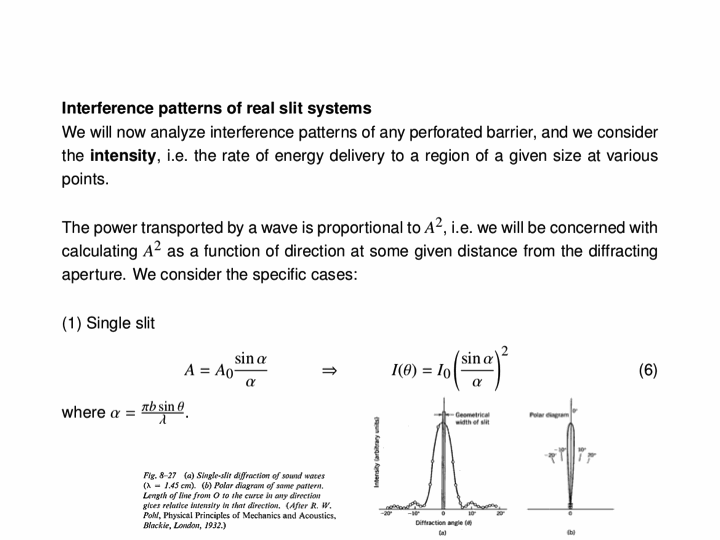
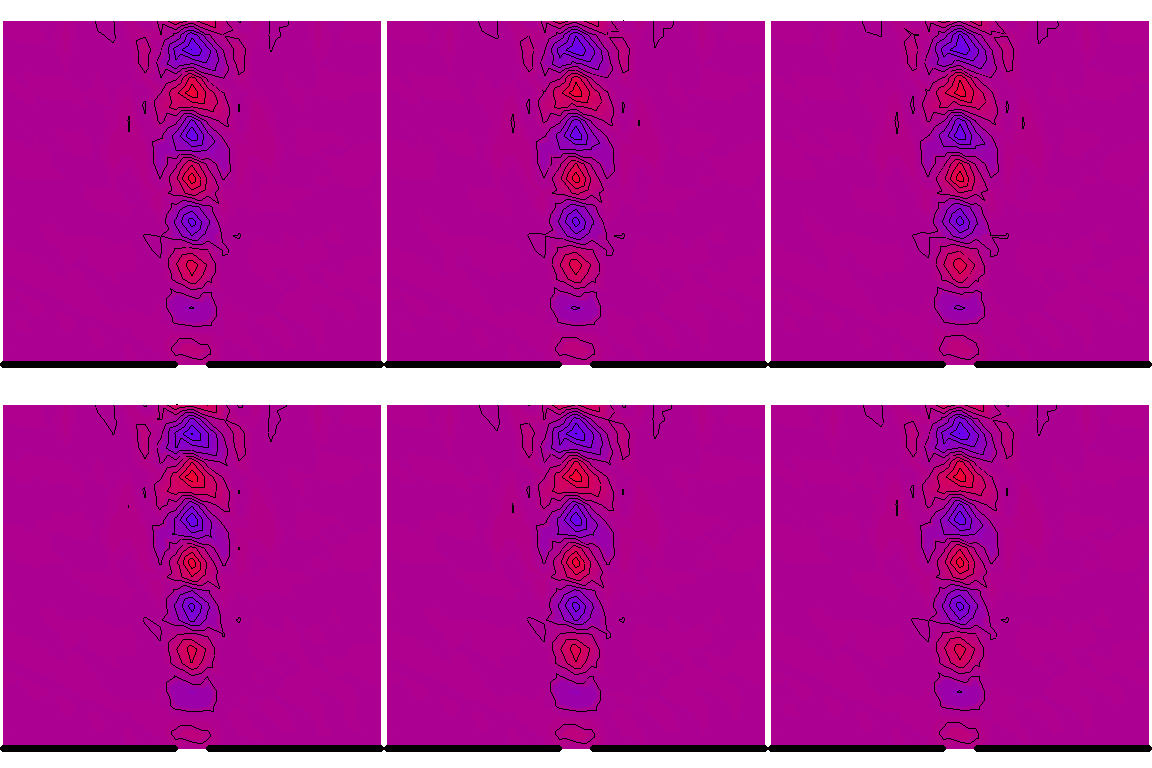
Now we look at a plane wave of frequency $\omega=\pi\,\mathrm{rad}\cdot\mathrm{s}^{-1}$ normally incident on a wall with a single wide slit in it, and see how the diffraction depends on the wave's wavelength in comparison to the slit's size. The following six animations show what happens when the wavelength-to-slit width ratio is, respectively, 0.1, 0.2, 0.5, 1, 2 and 5:
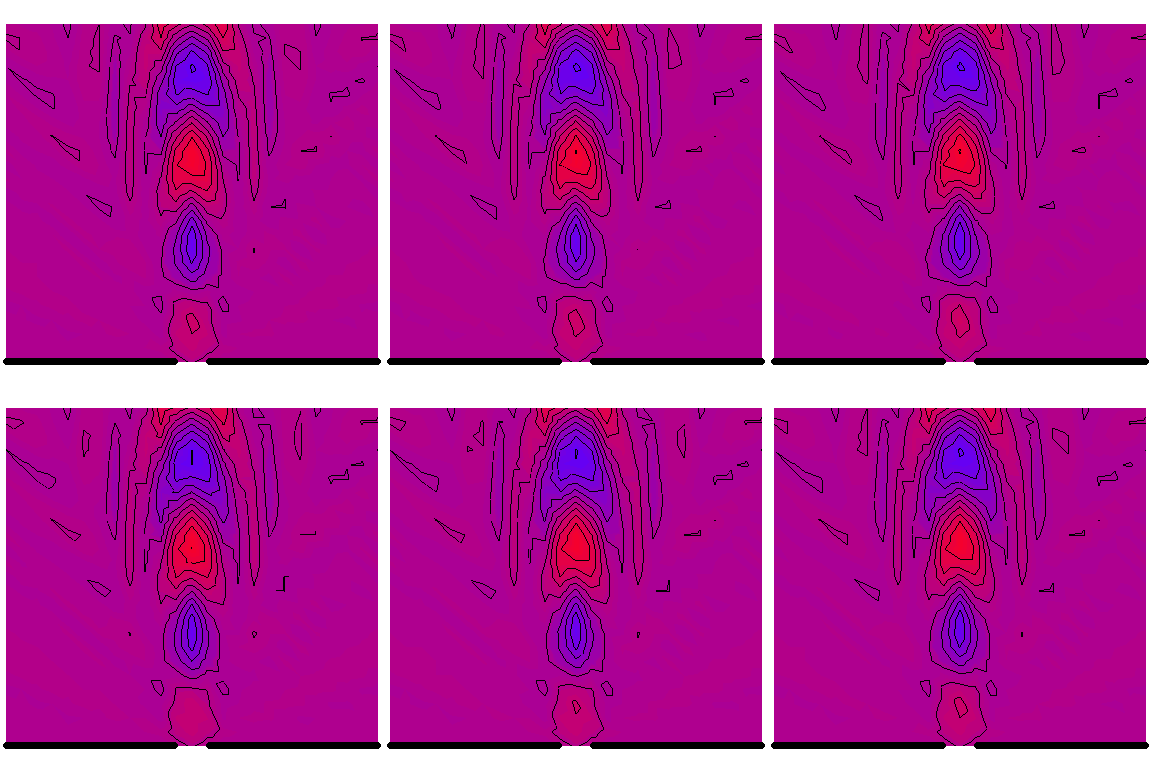
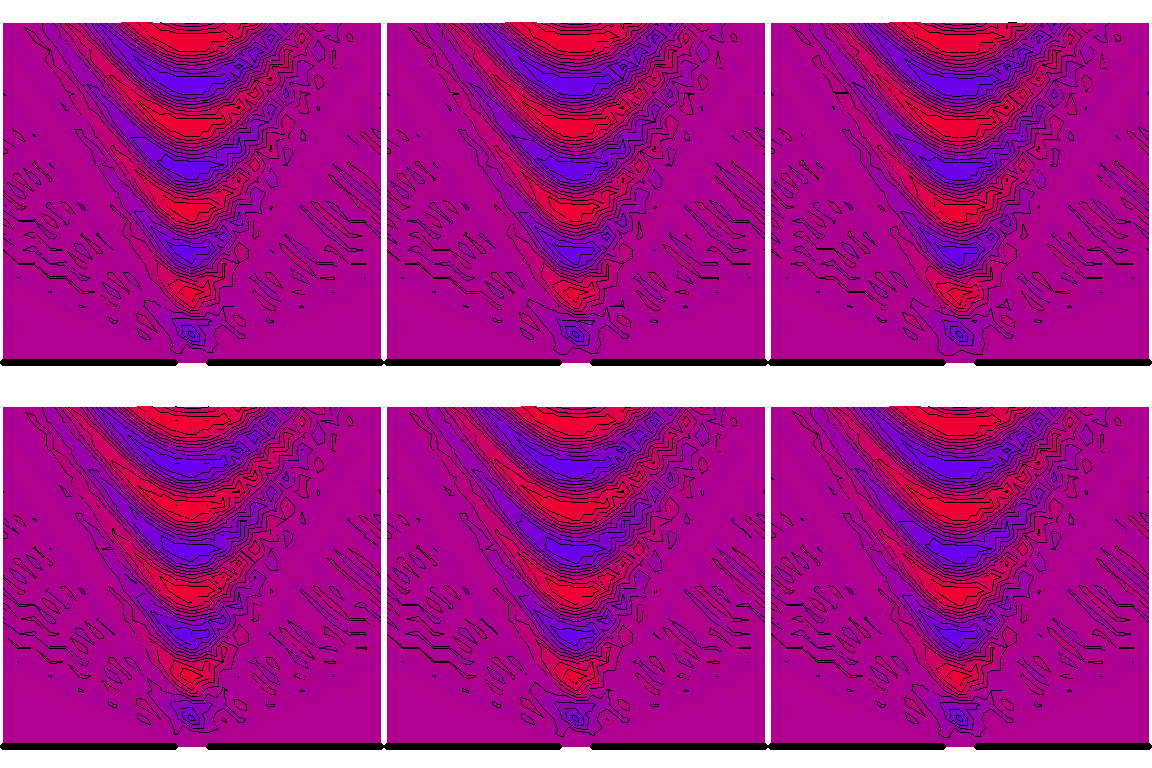
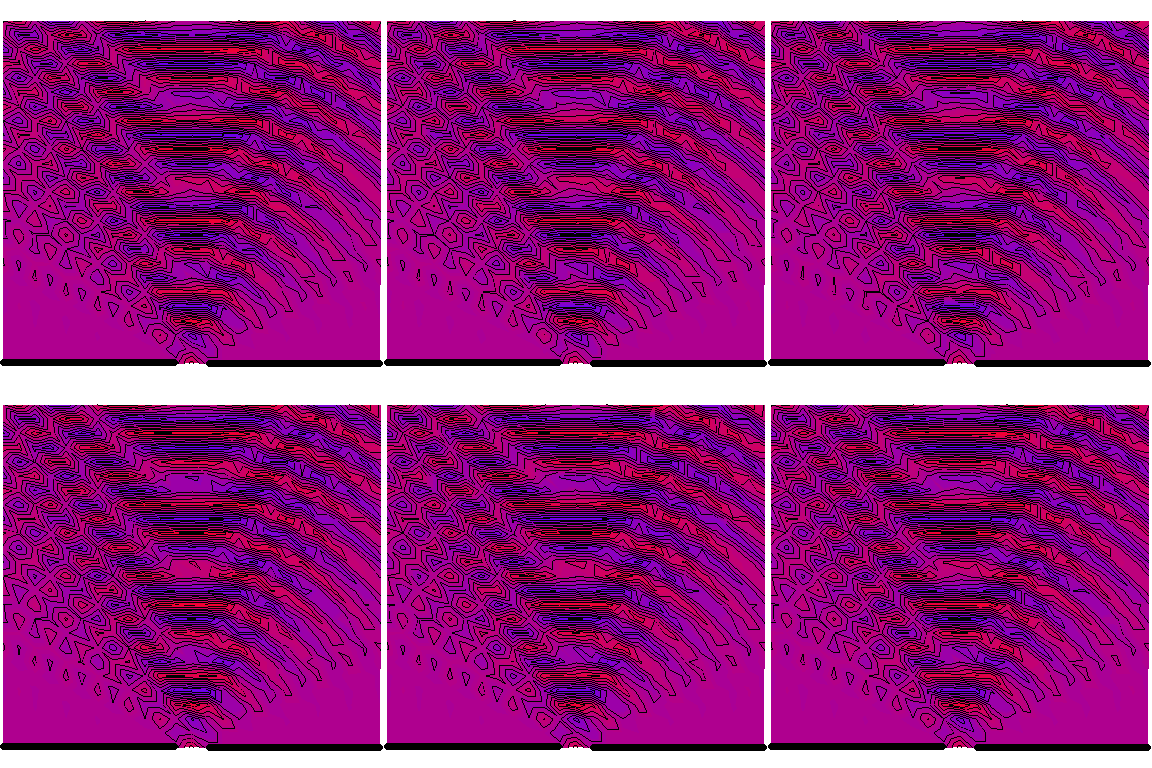
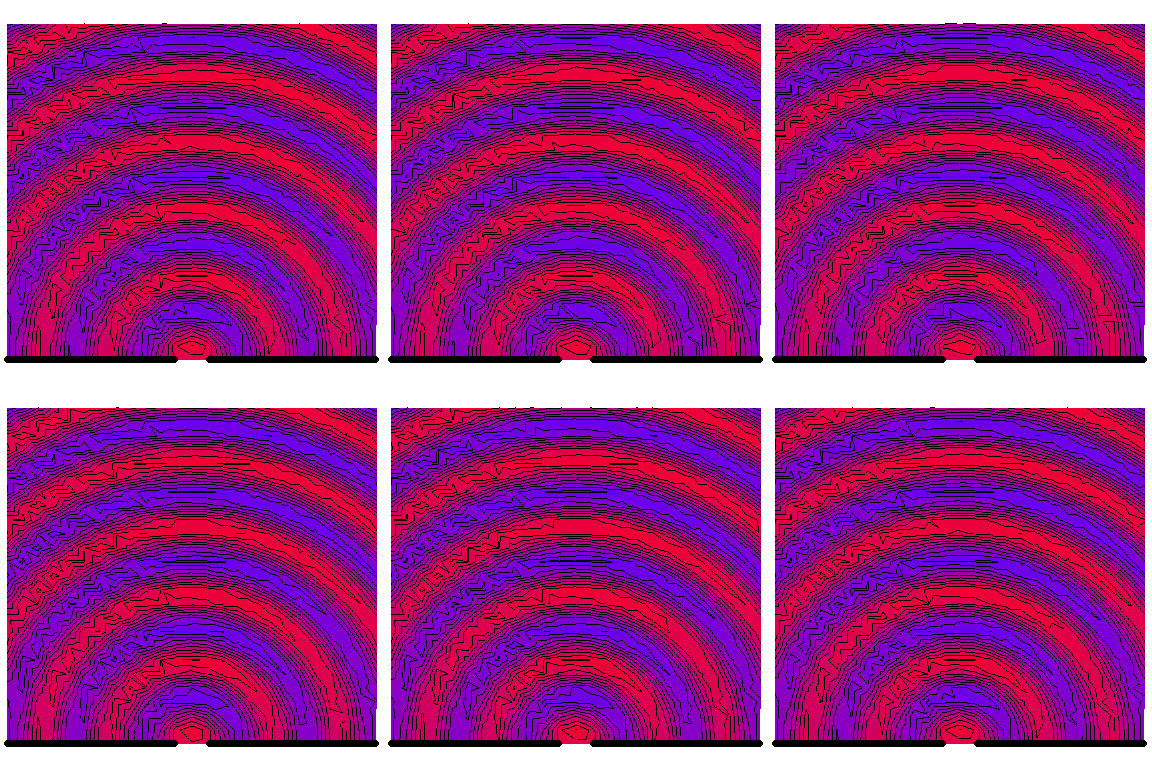
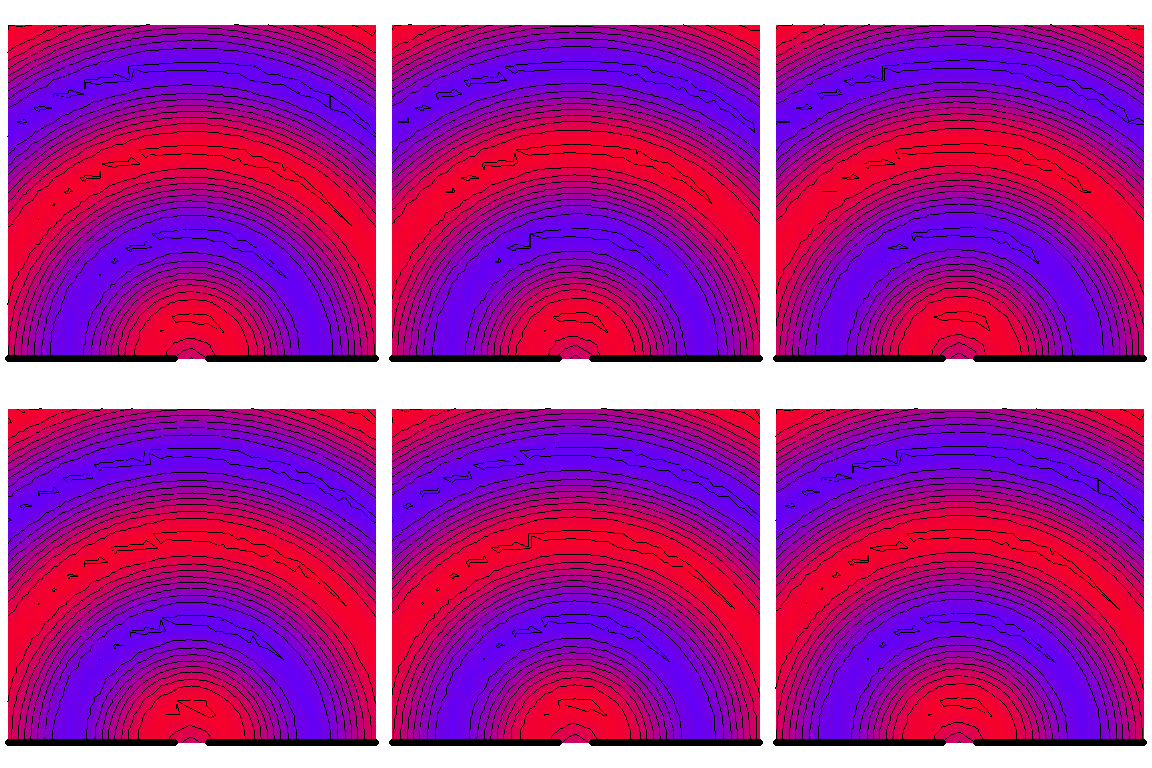 Note that the smaller the ratio, the more collimated the diffracted wave is, and the larger the ratio, the more the diffracted wave appears to be emanating from a point source.
