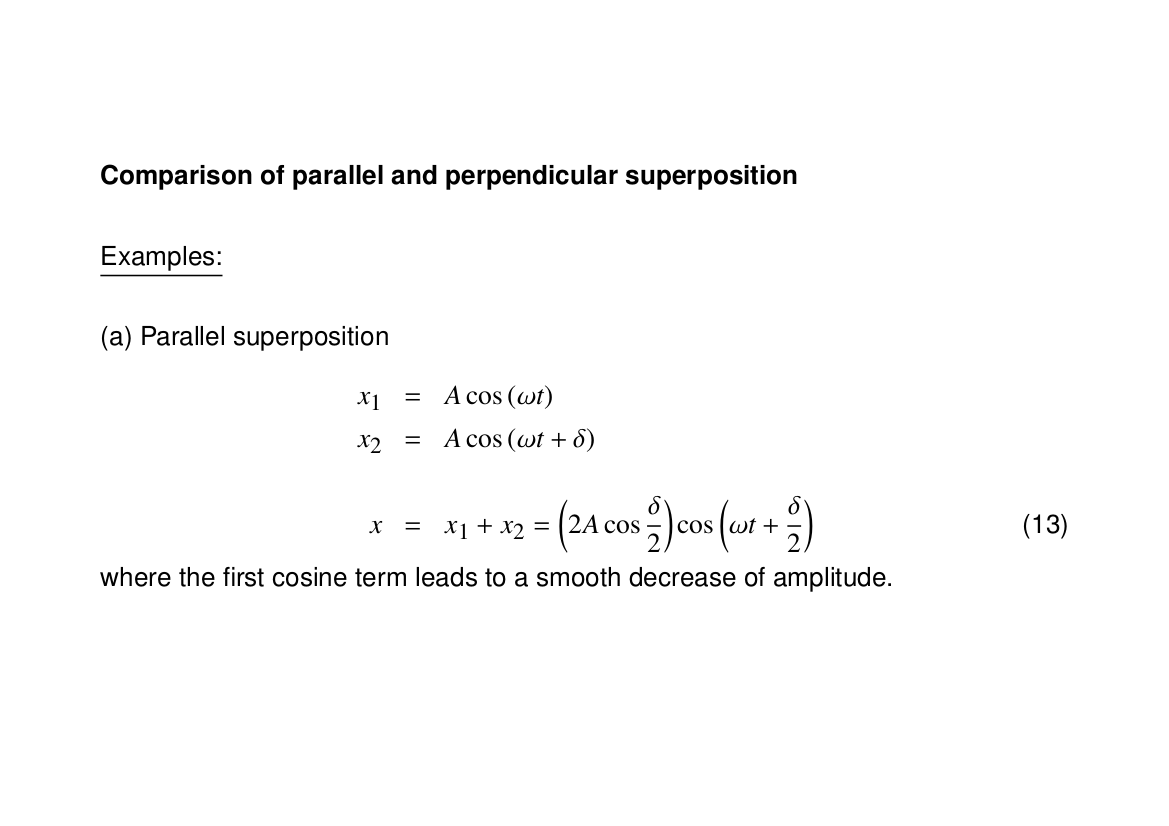
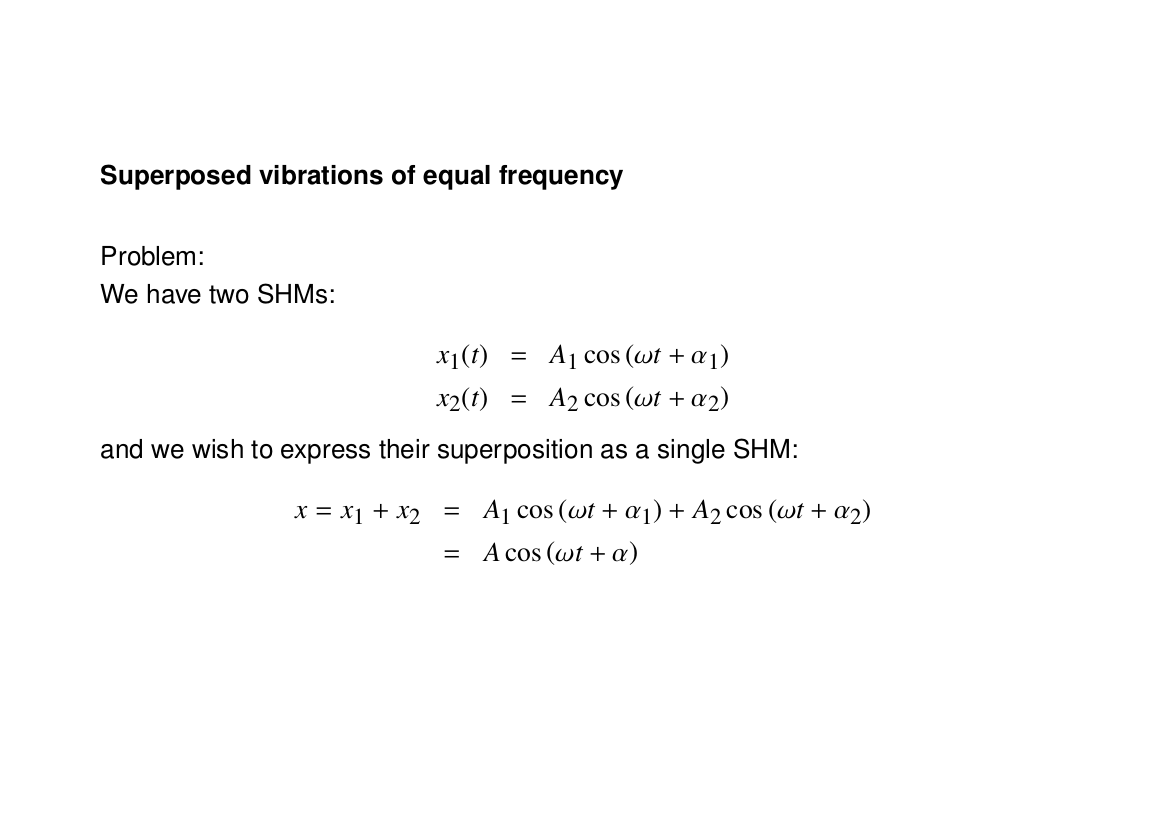
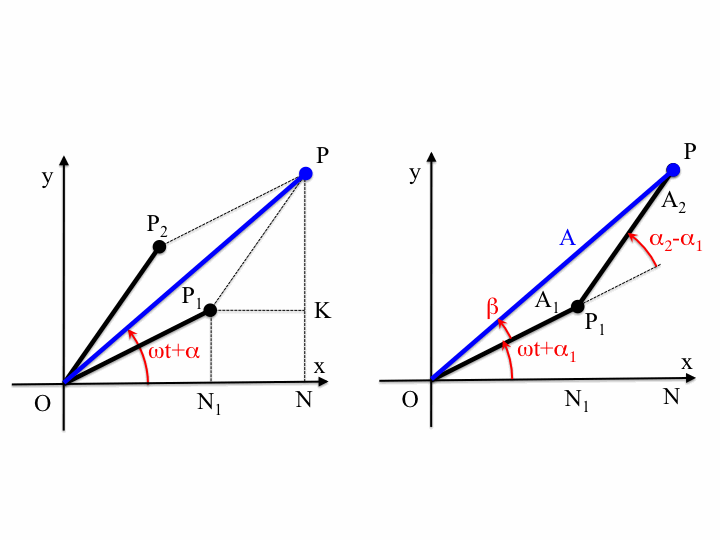
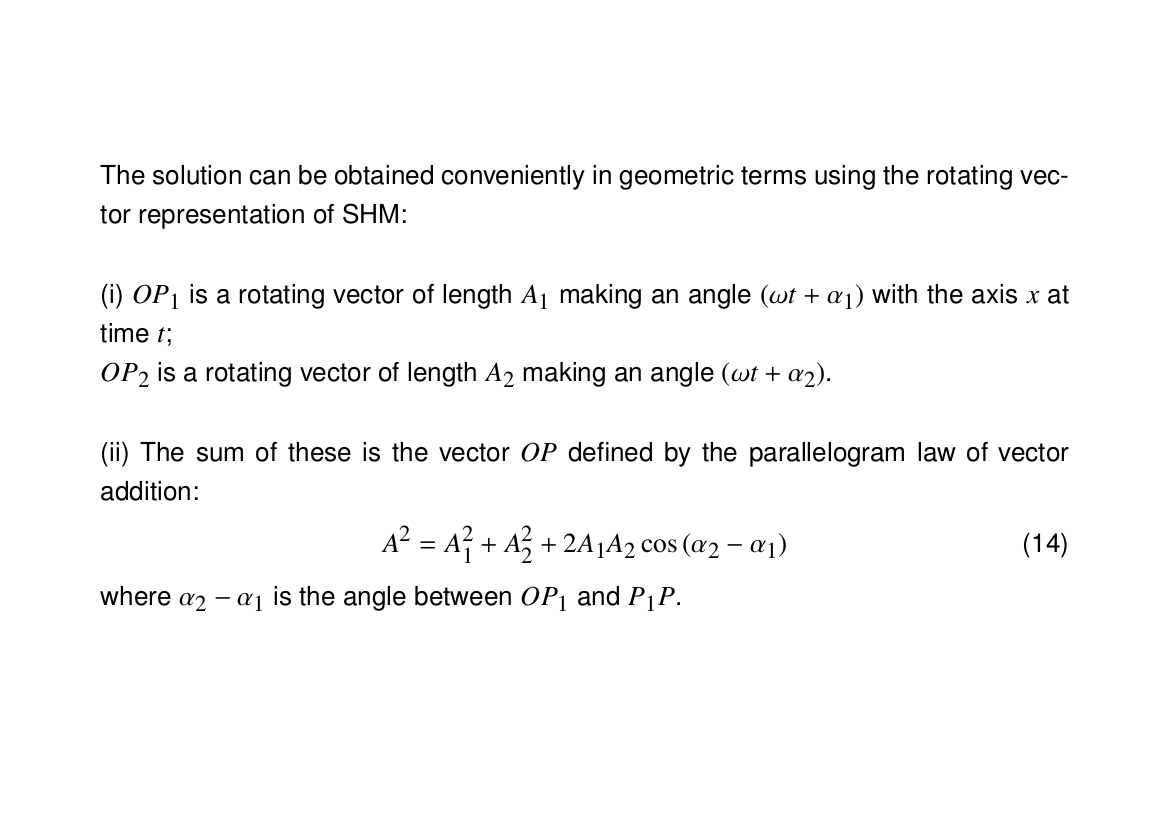
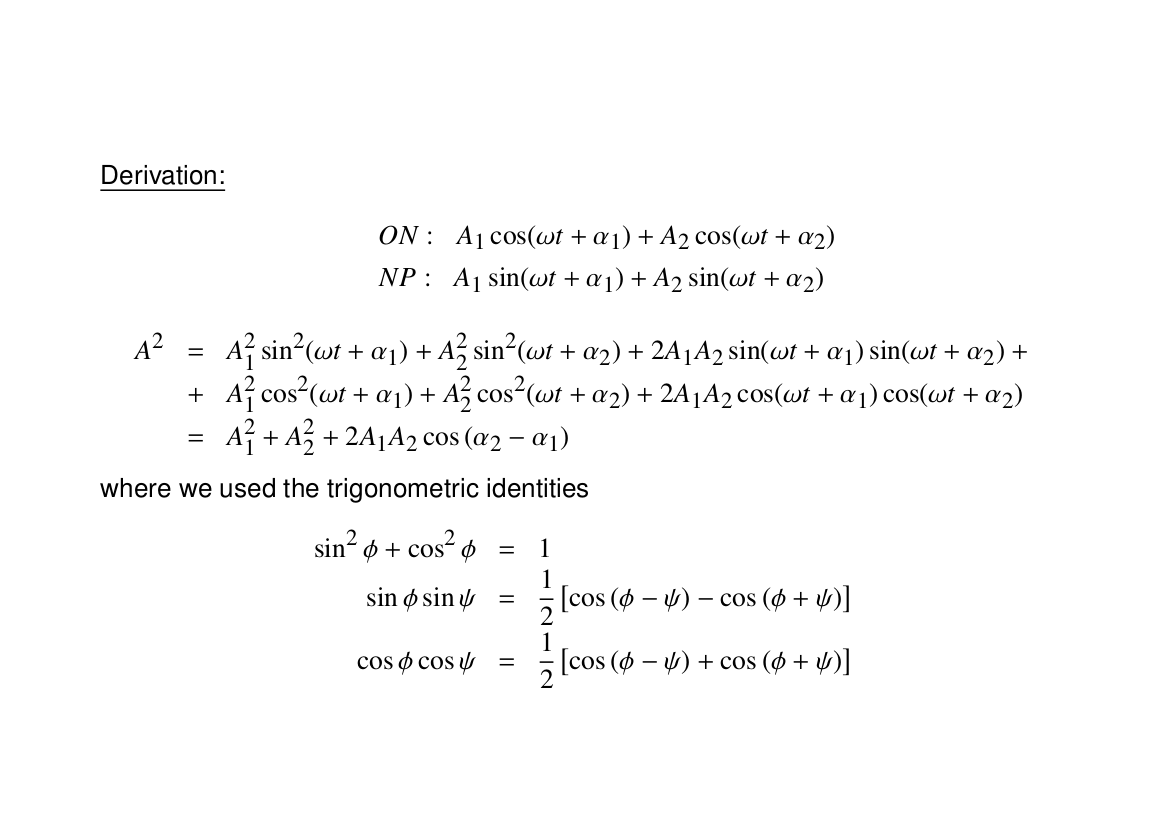
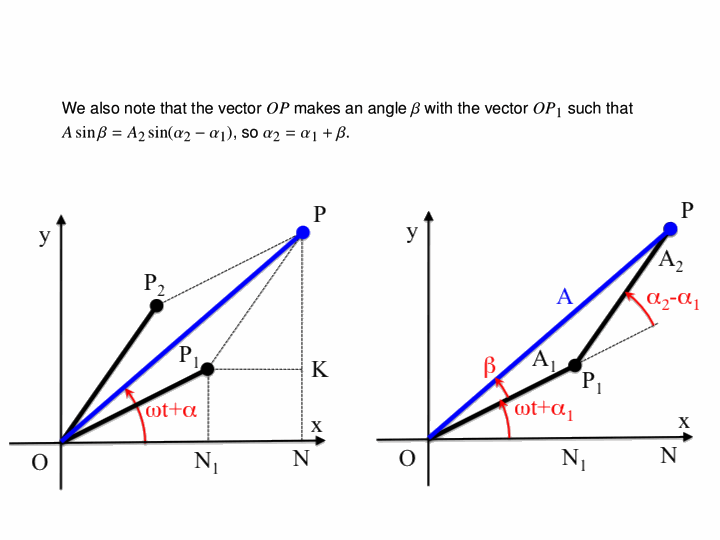
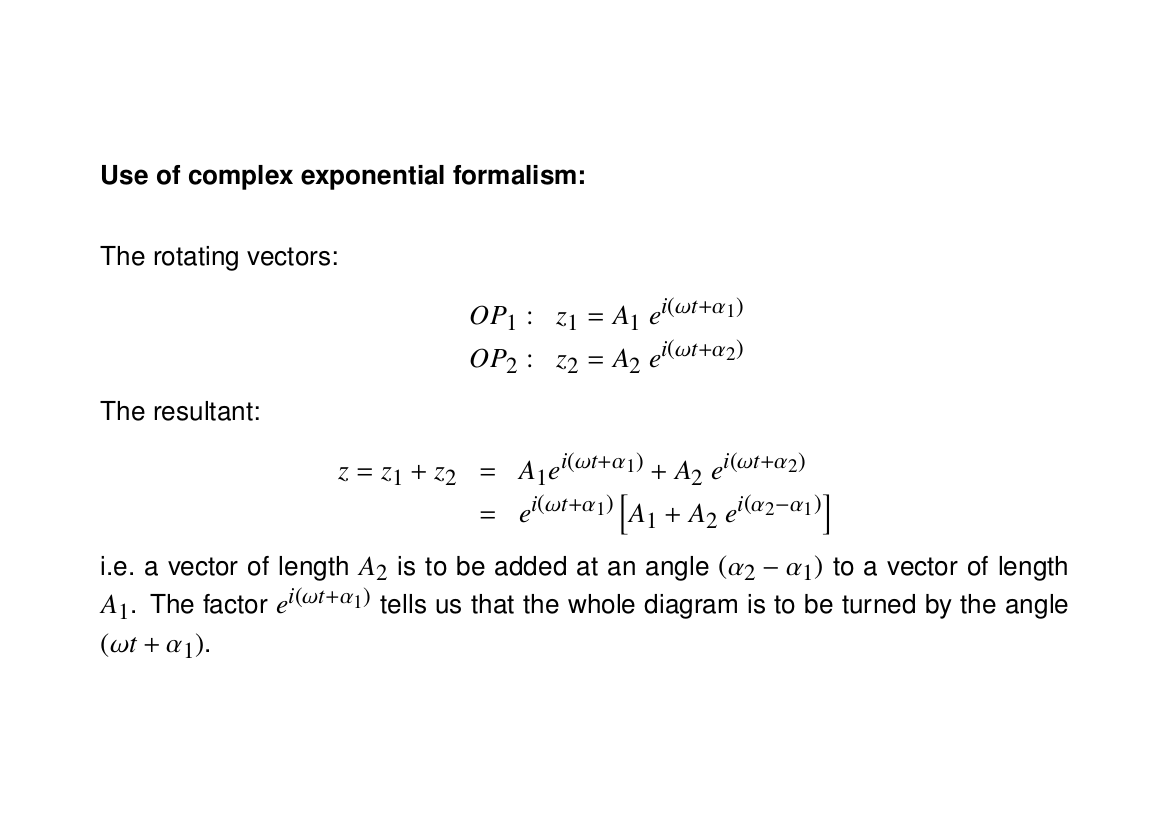
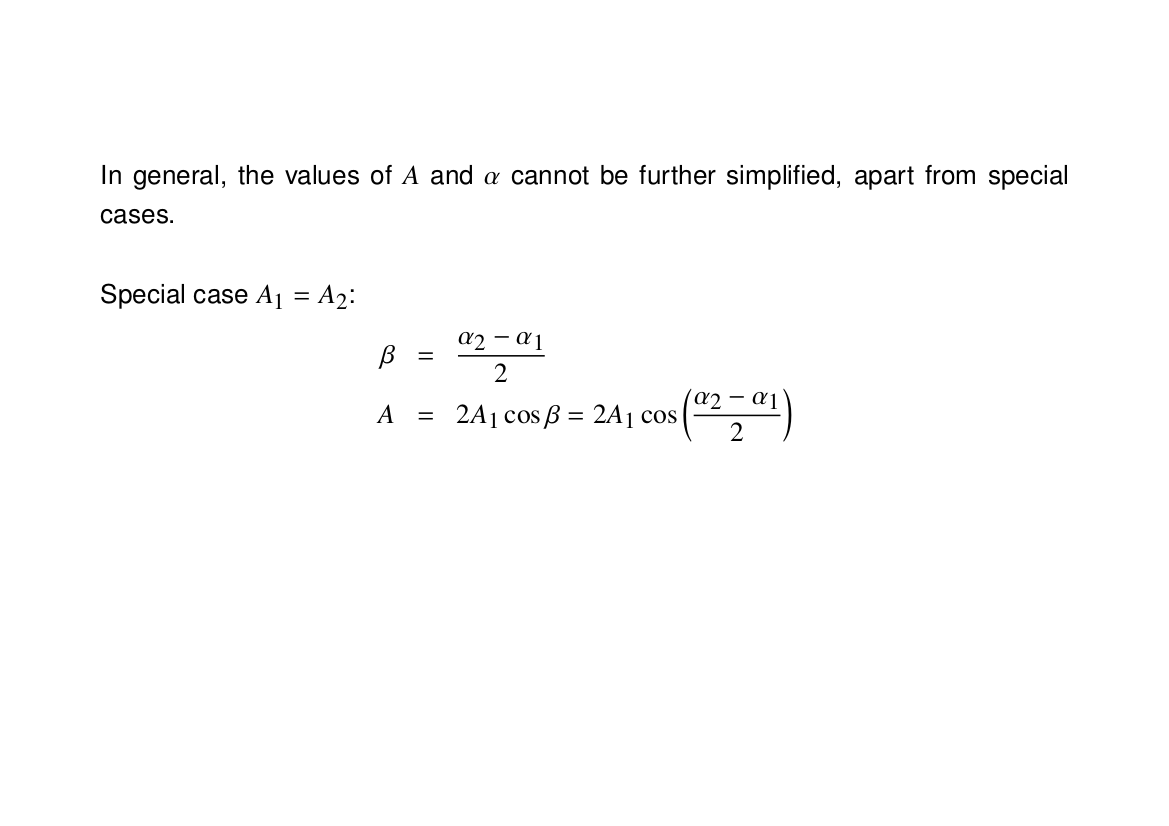
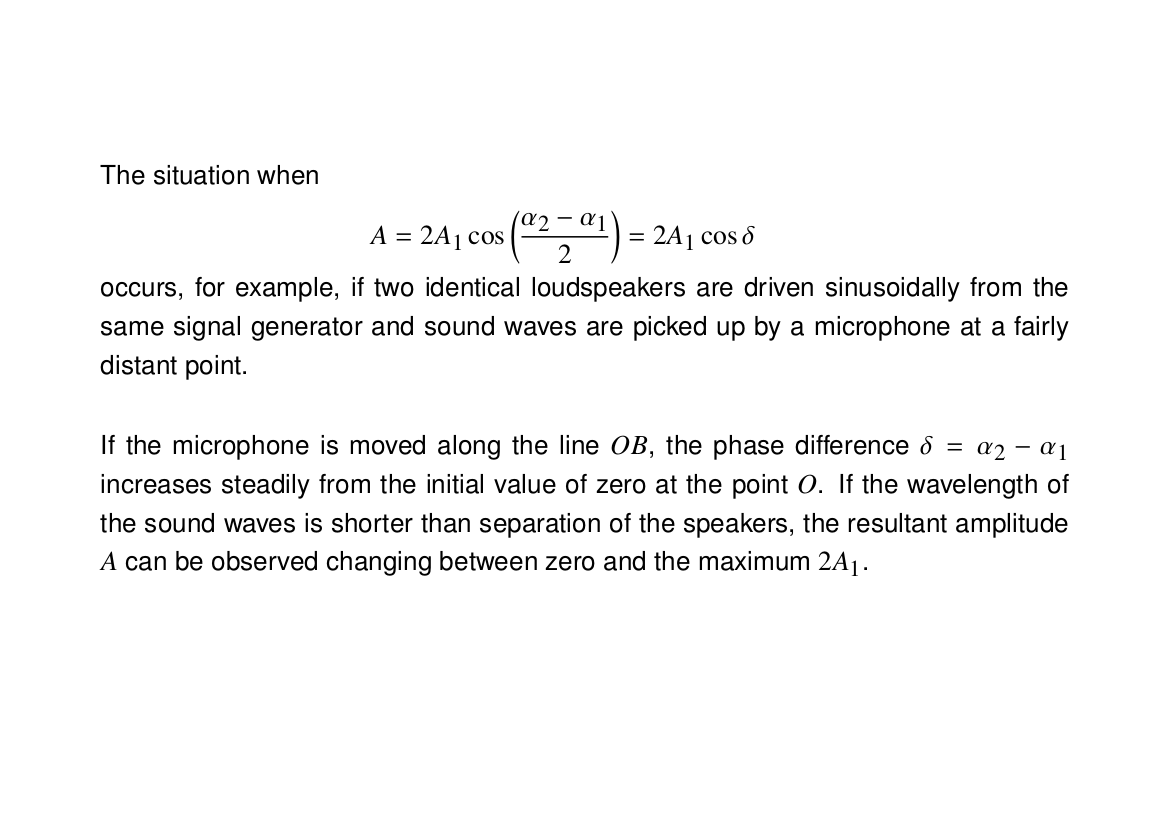
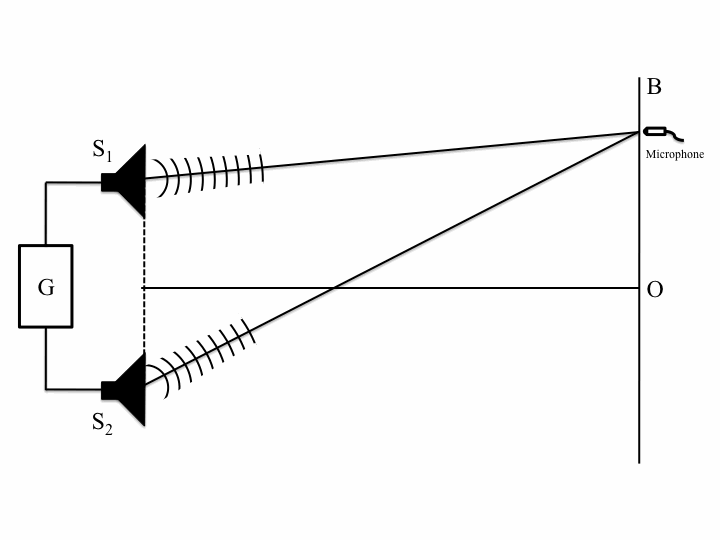
We know that oscillations in one dimension can be viewed as the projection of a rotating vector in two dimensions. This means that the superposition of two oscillations can be represented as the addition of two time-dependent complex vectors. The below animation shows this for two oscillations of the same frequency $3\pi \,\mathrm{rad}\cdot\mathrm{s}^{-1}$ but different amplitudes (one is twice as big as the other) and phases (a difference of $90^{\circ}$):
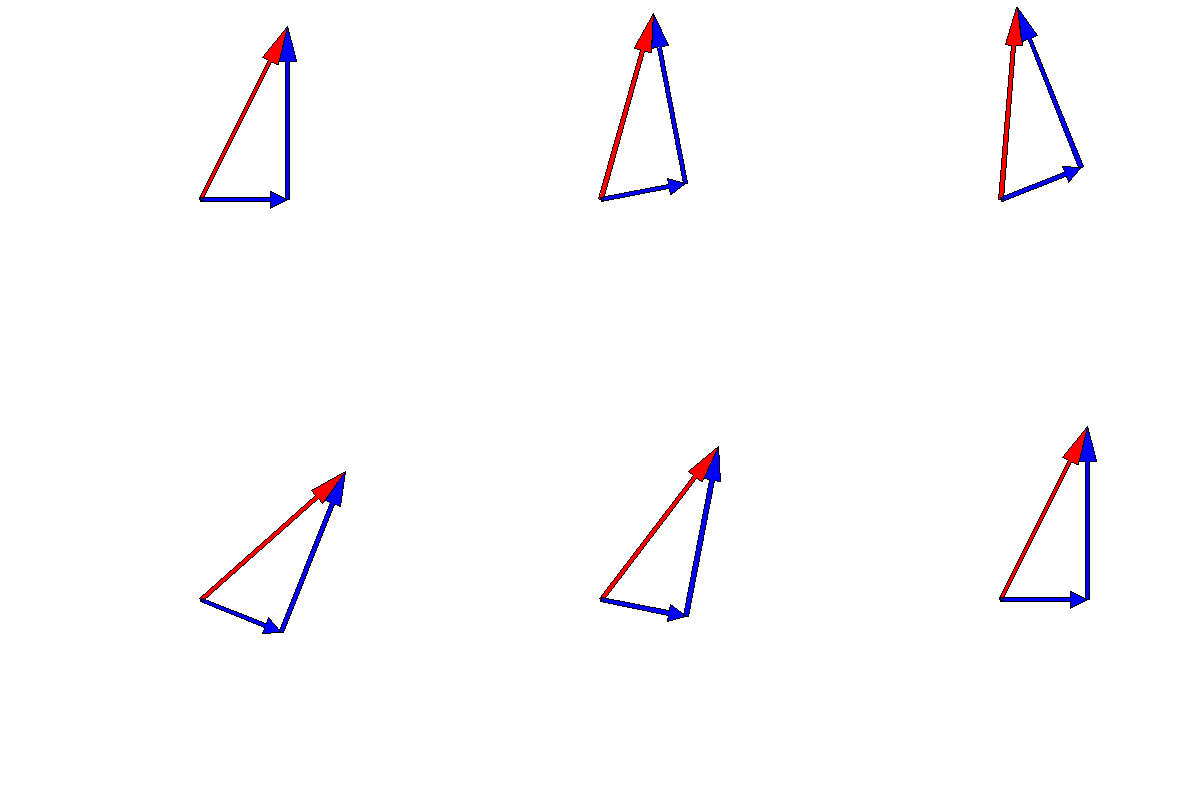 Note that the sum -- the red arrow -- does not change its length, so the amplitude of the superposition is constant over time.
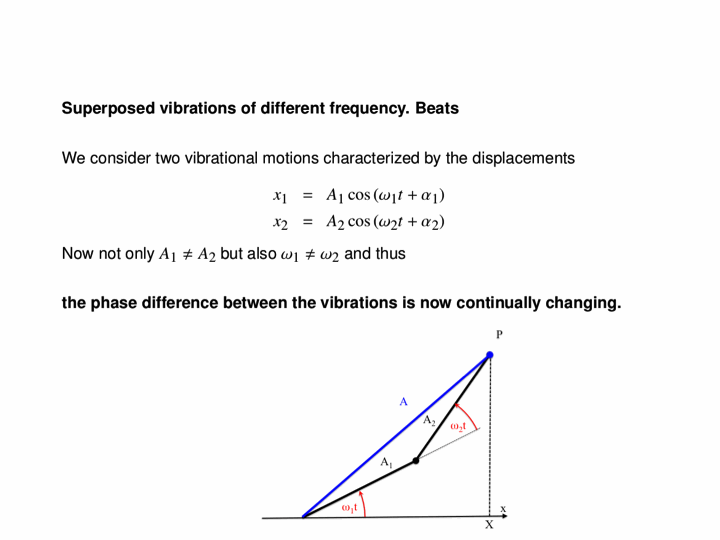
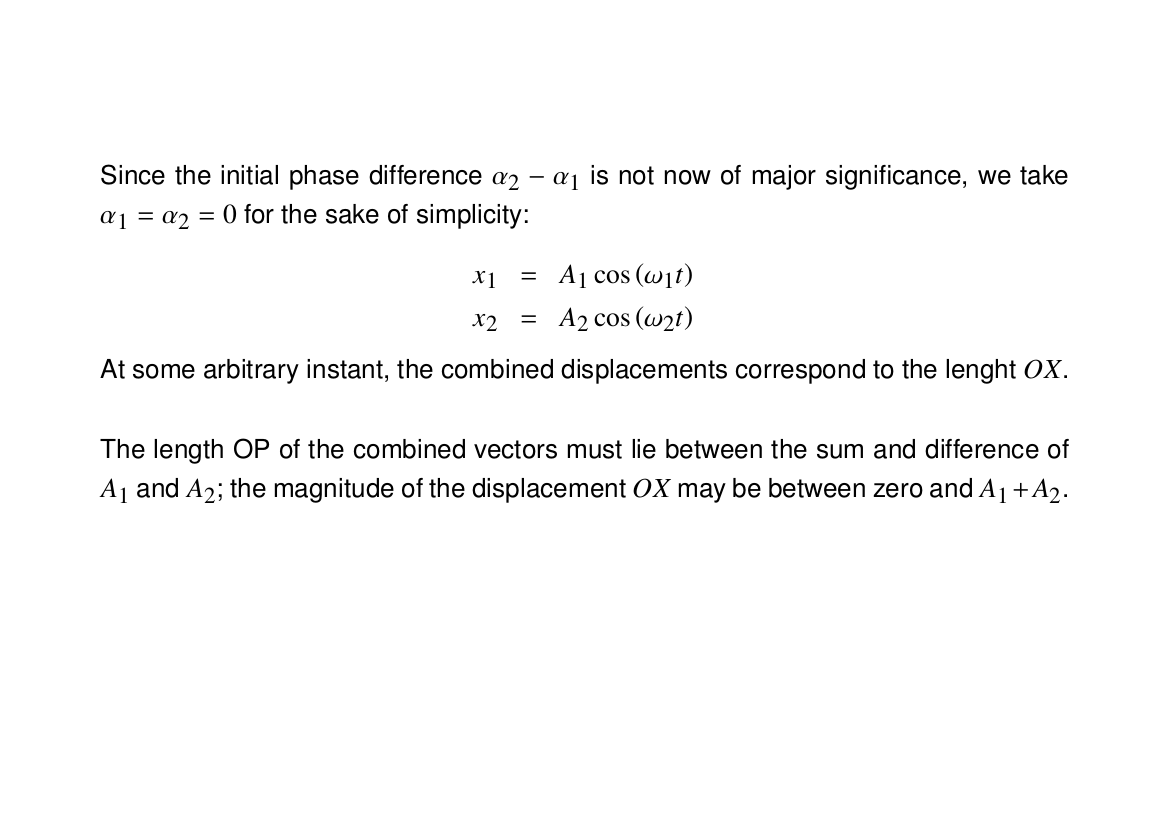
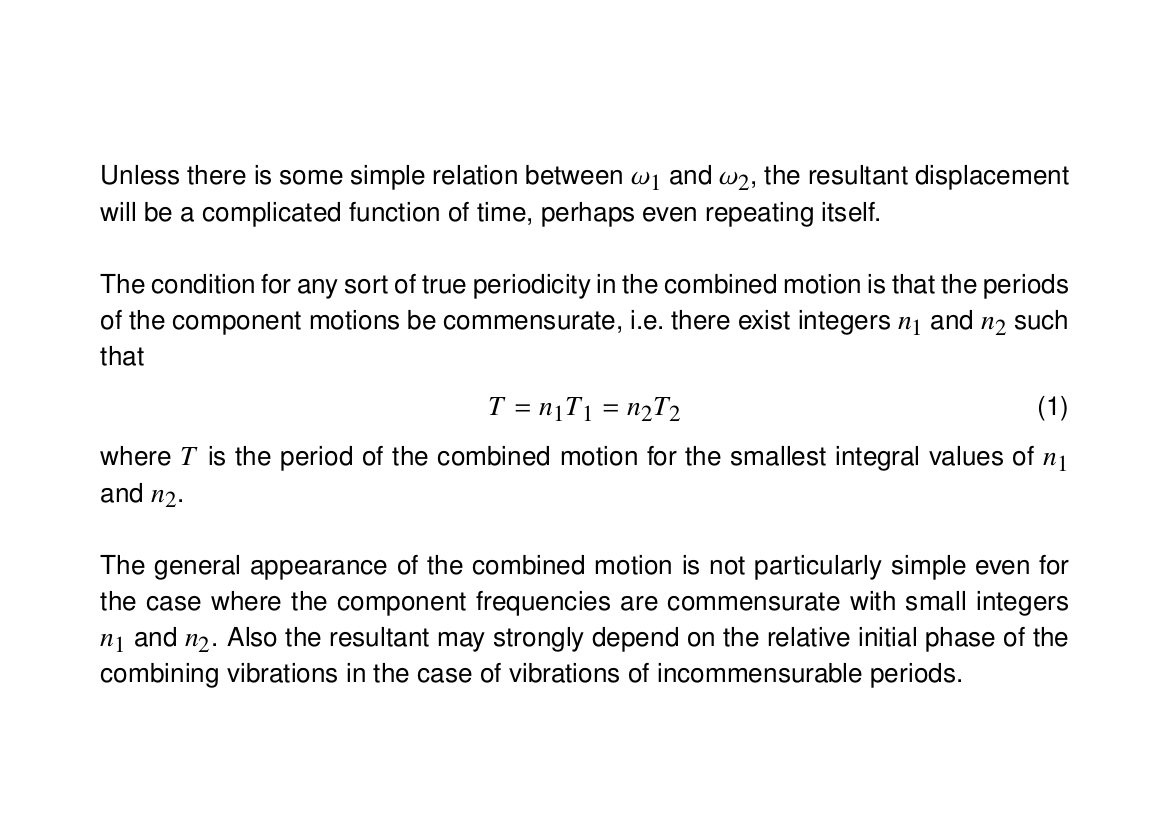
The next animation illustrates what happens when the frequencies are different, with one being $3\pi \,\mathrm{rad}\cdot\mathrm{s}^{-1}$ and the other being $4\pi \,\mathrm{rad}\cdot\mathrm{s}^{-1}$:
 In this case, the length of the sum does vary, so the superposition of the two oscillations produces a time-dependent amplitude.
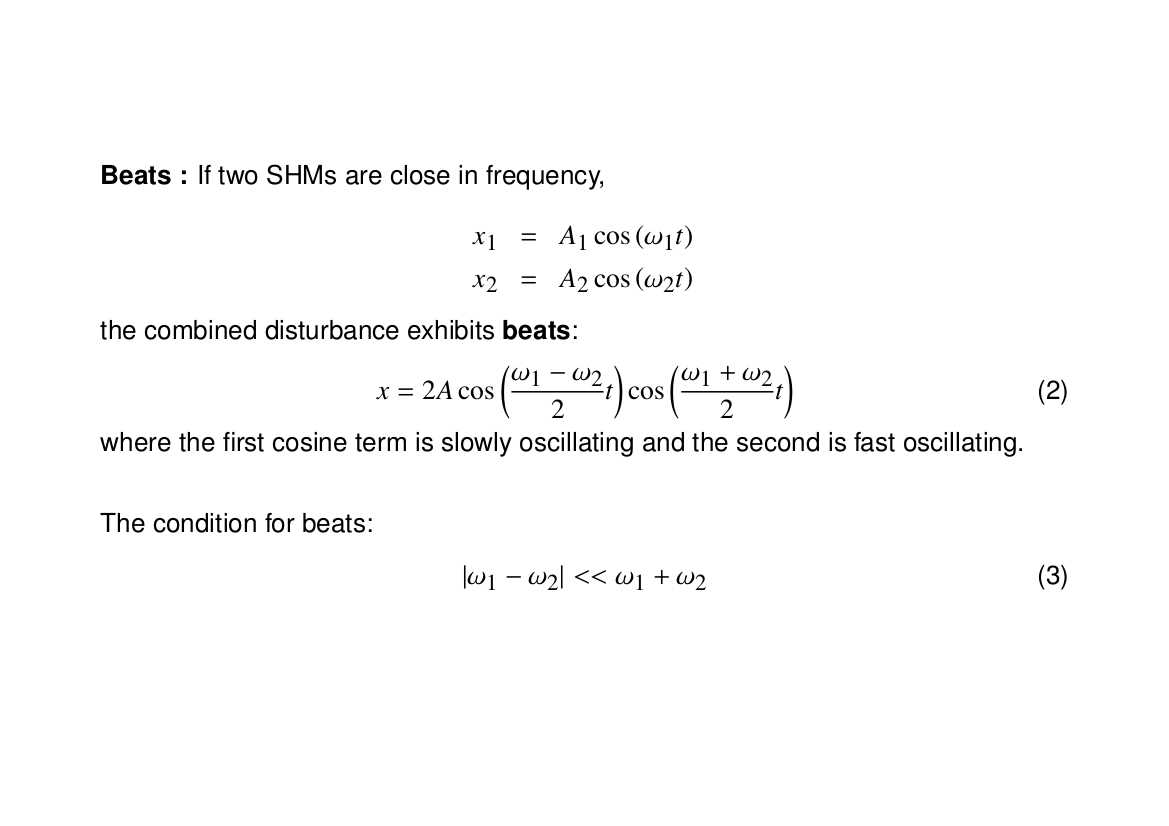
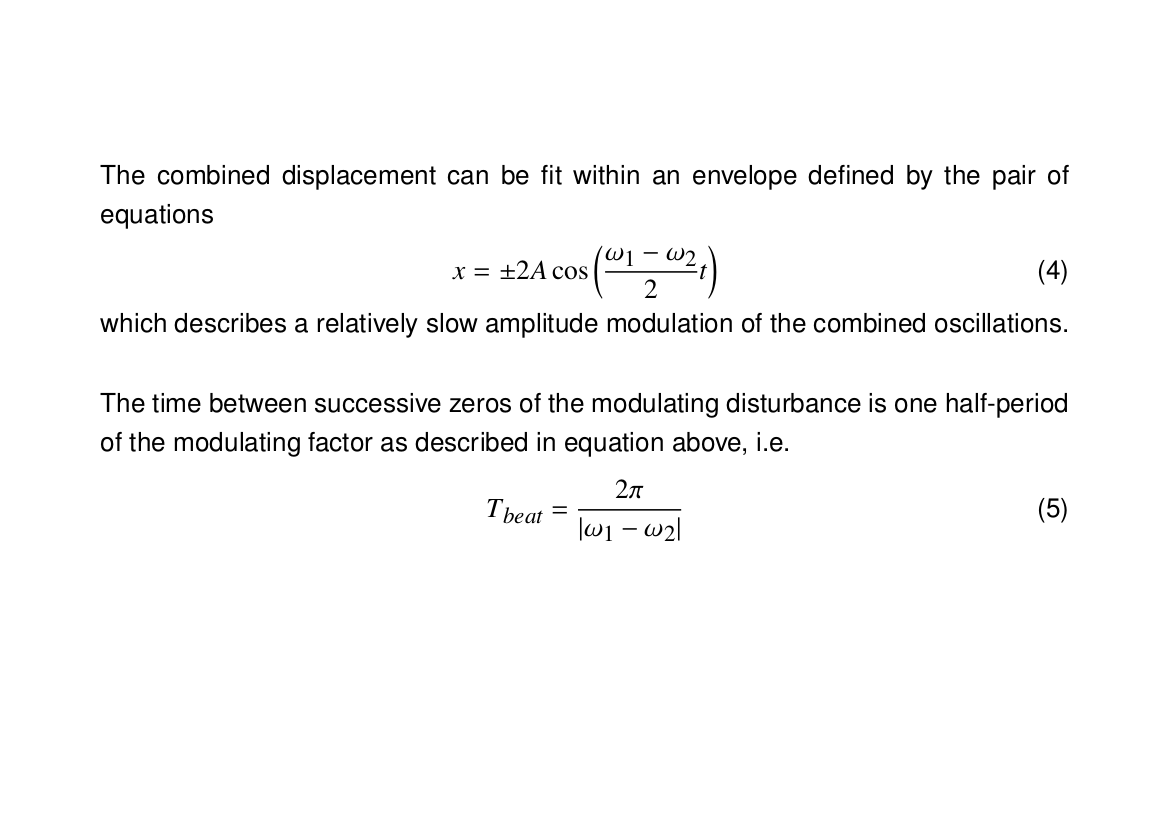
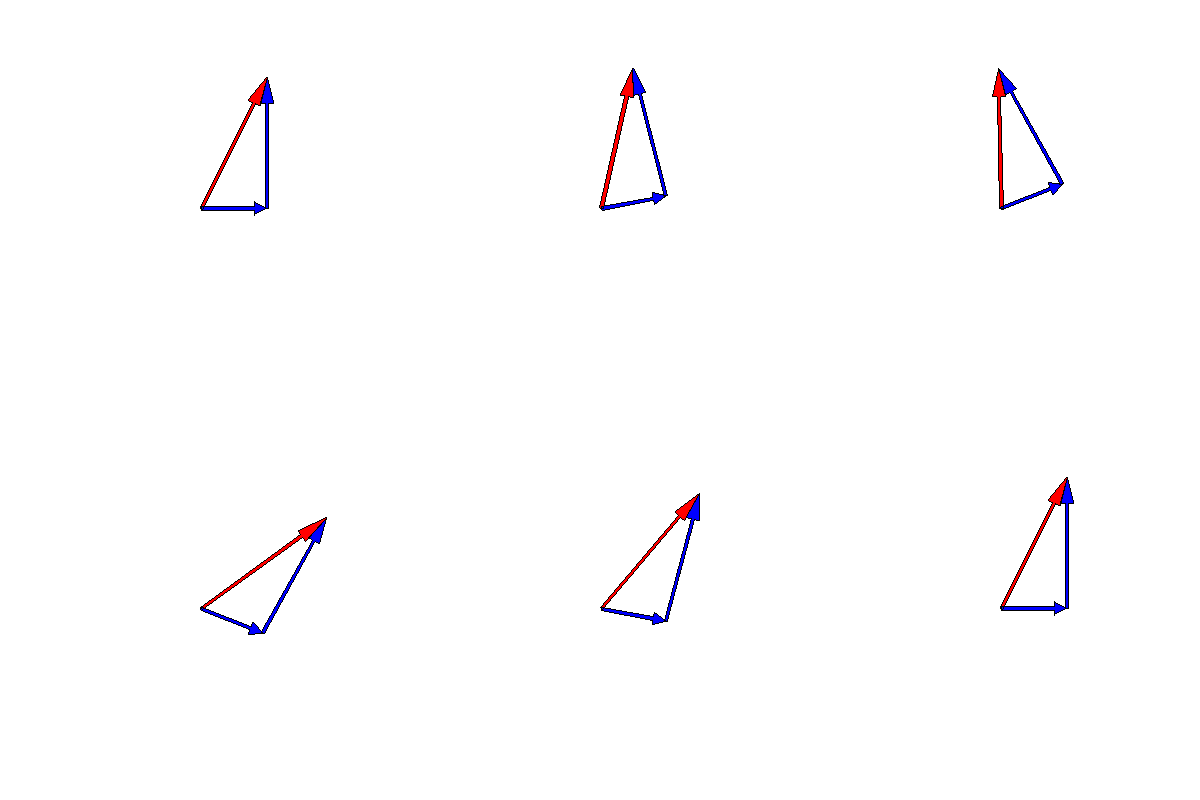
This phenomenon is called "beating", and is most pronounced when the two frequencies are close together. The below animation shows two oscillations of frequencies $\omega_1=6\pi \,\mathrm{rad}\cdot\mathrm{s}^{-1}$ and $\omega_2=0.8\omega_1$, followed by the sum of the two. The result is a "sinewave inside a sinewave". This is the principle behind the amplitude modulation that's used for AM radio.

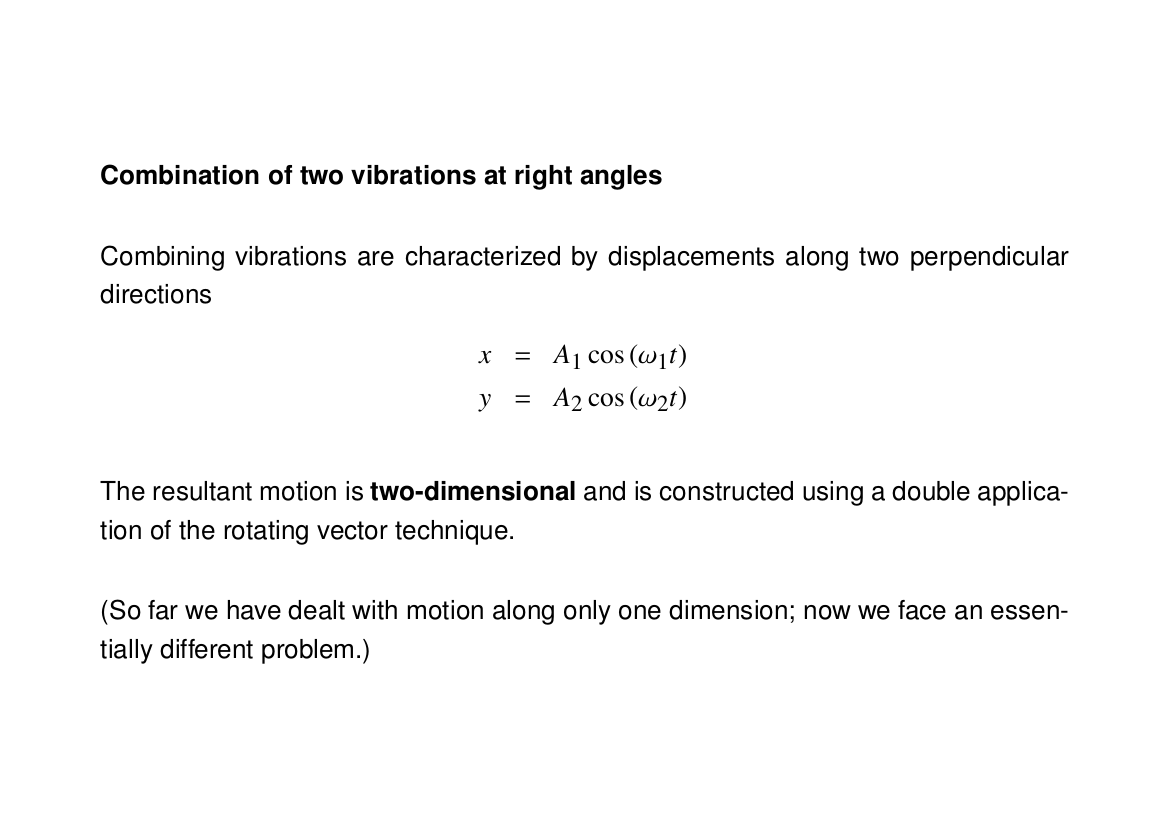
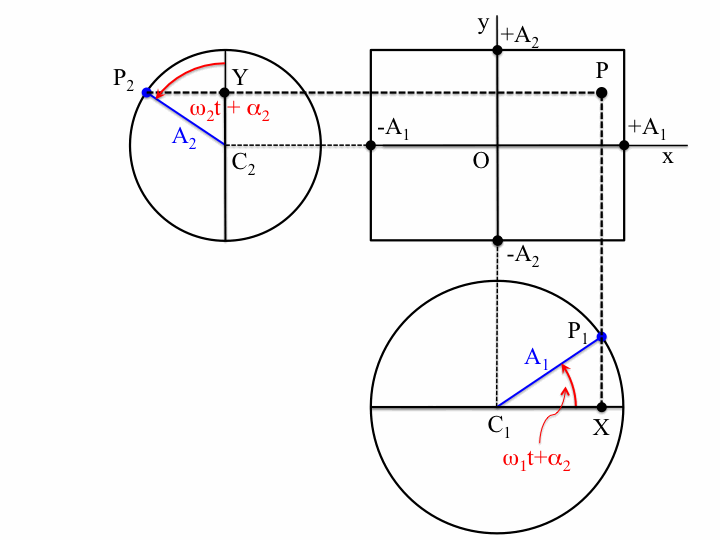
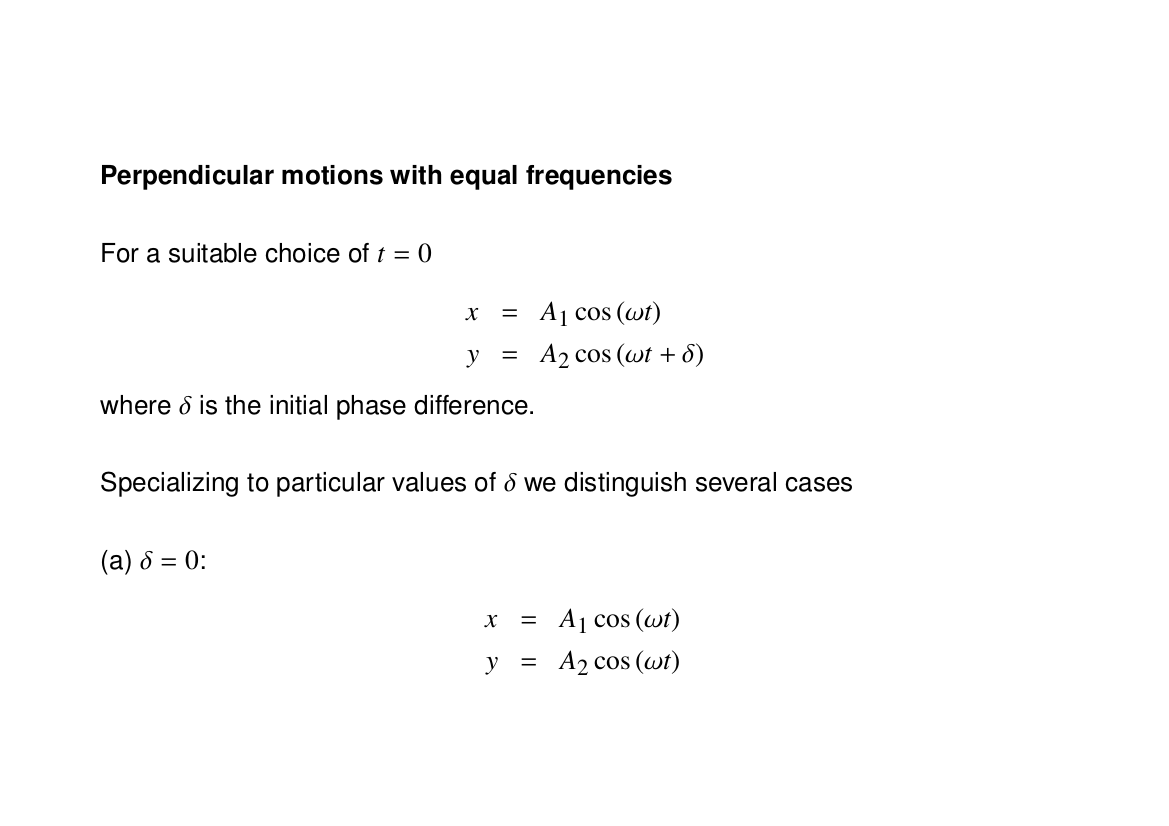
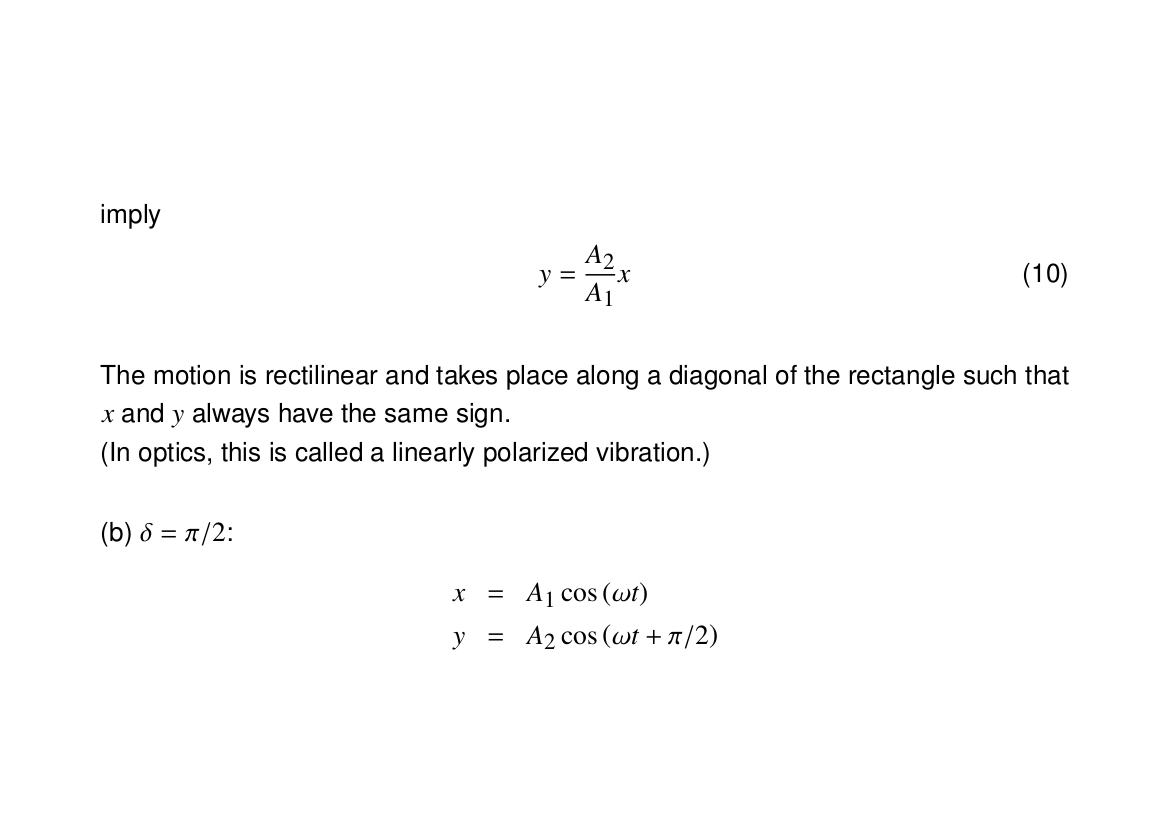
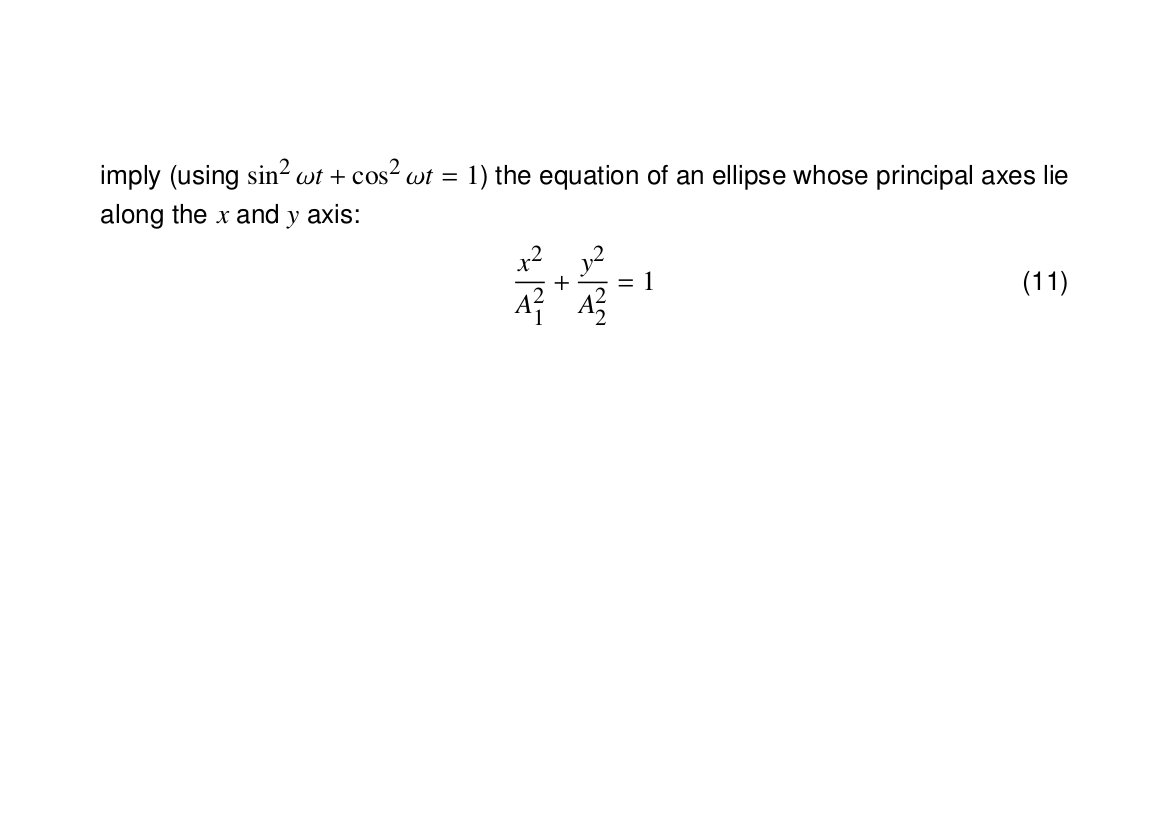
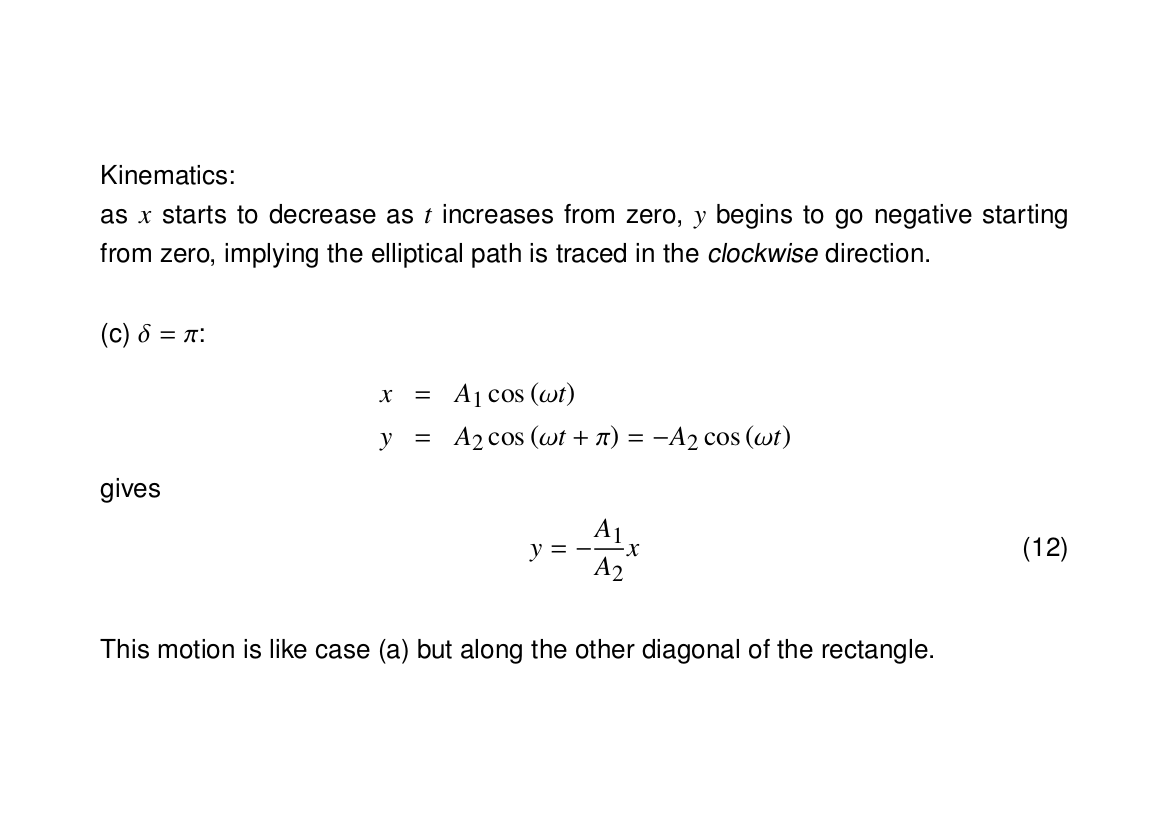
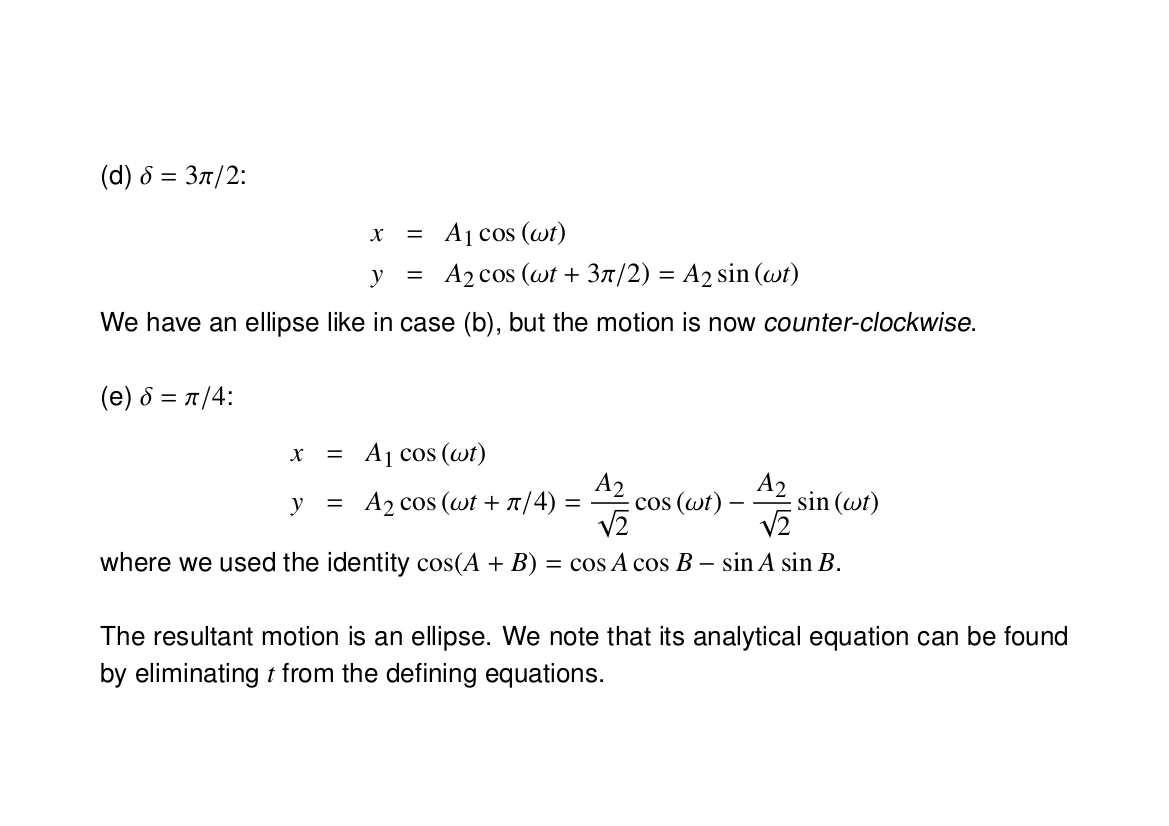
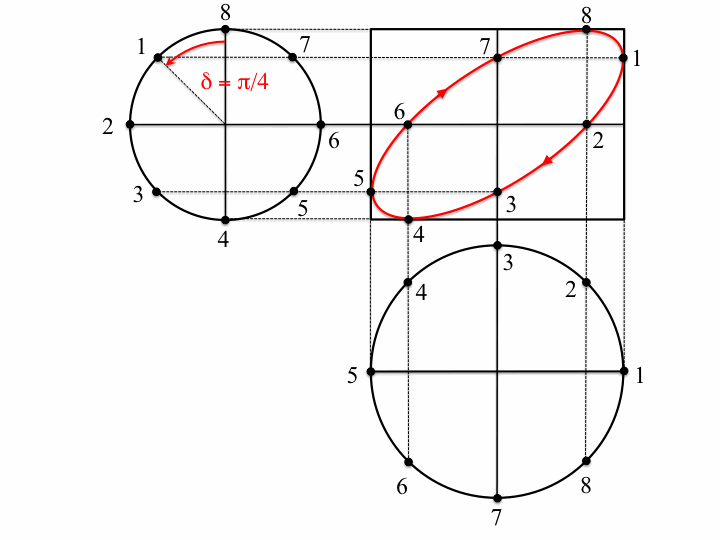
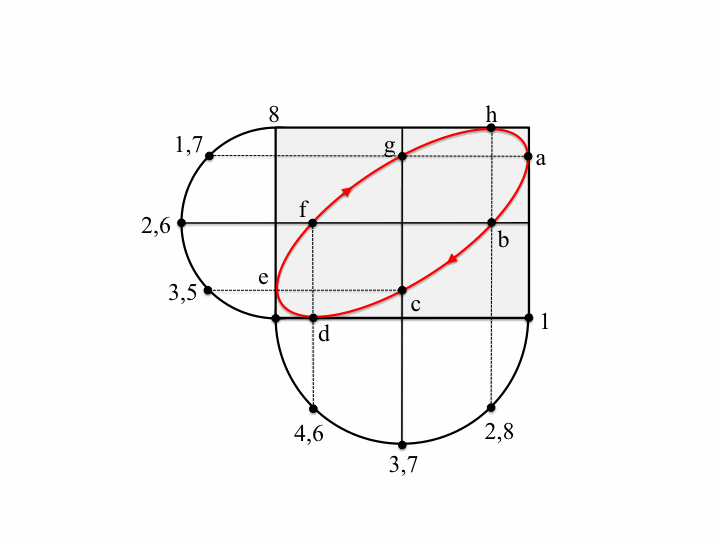
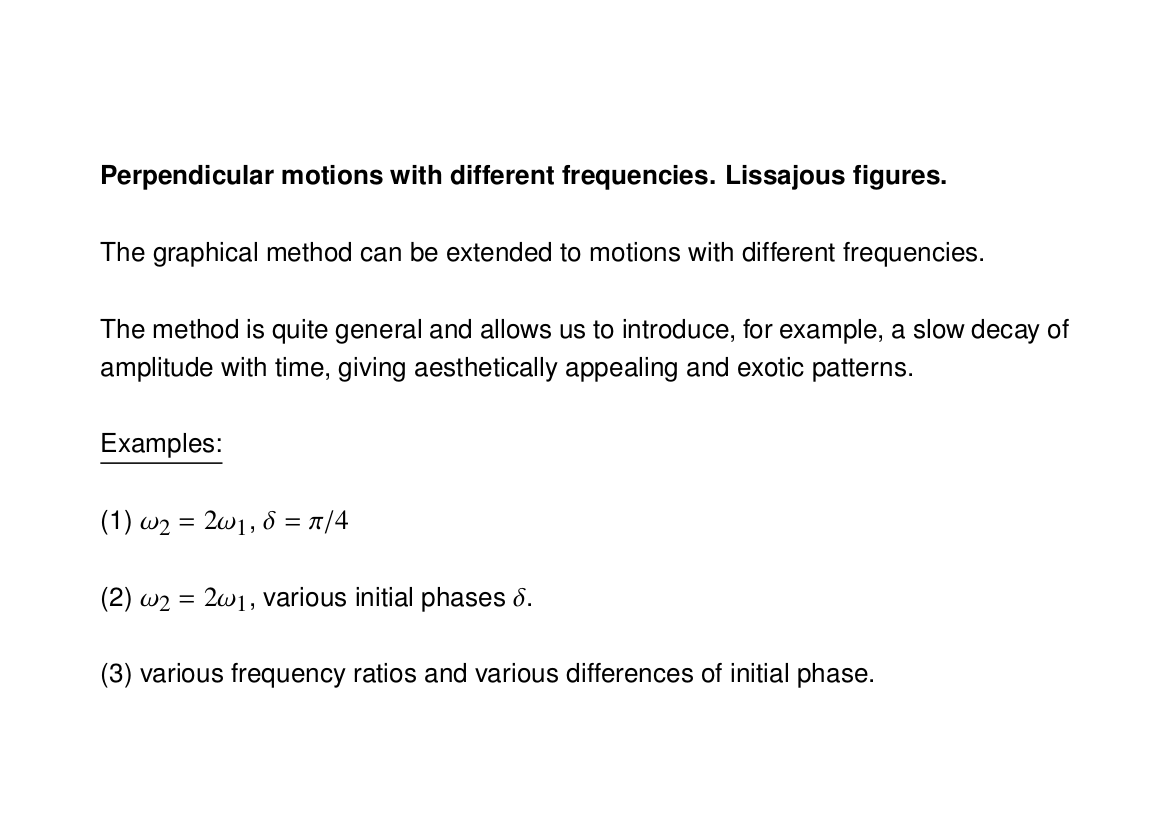
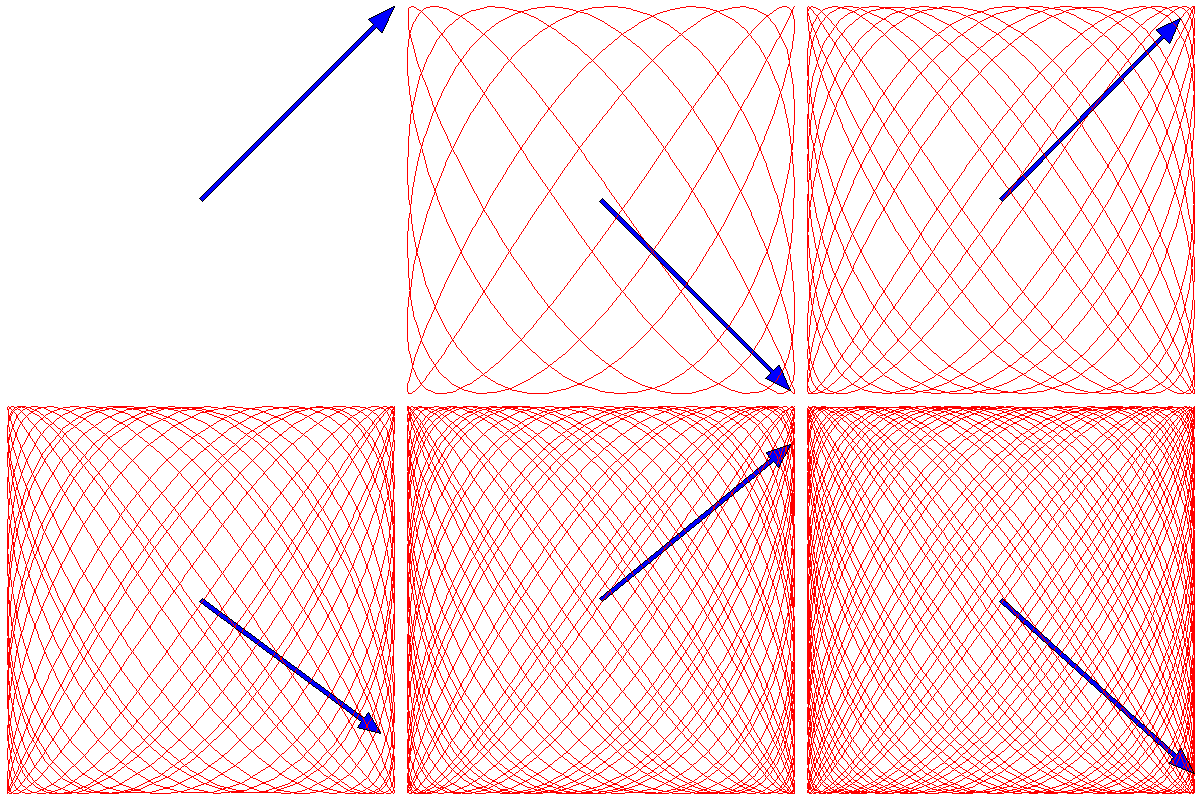
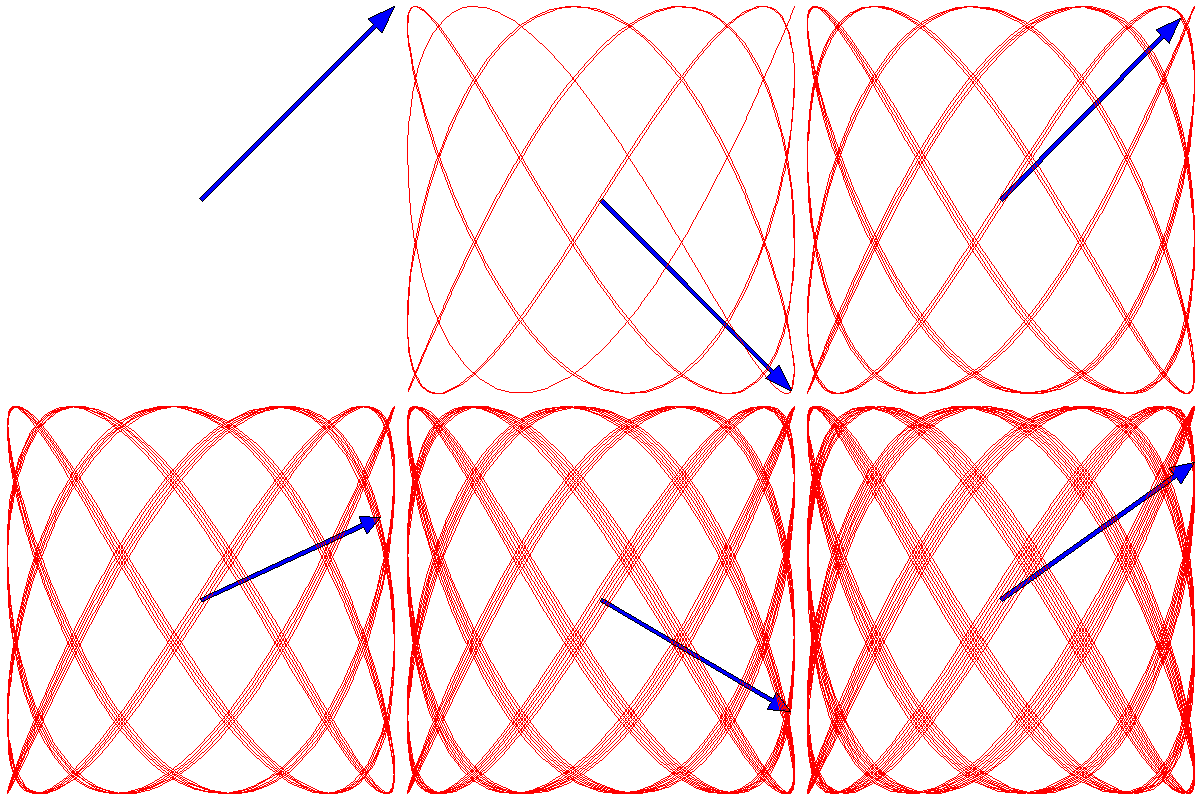
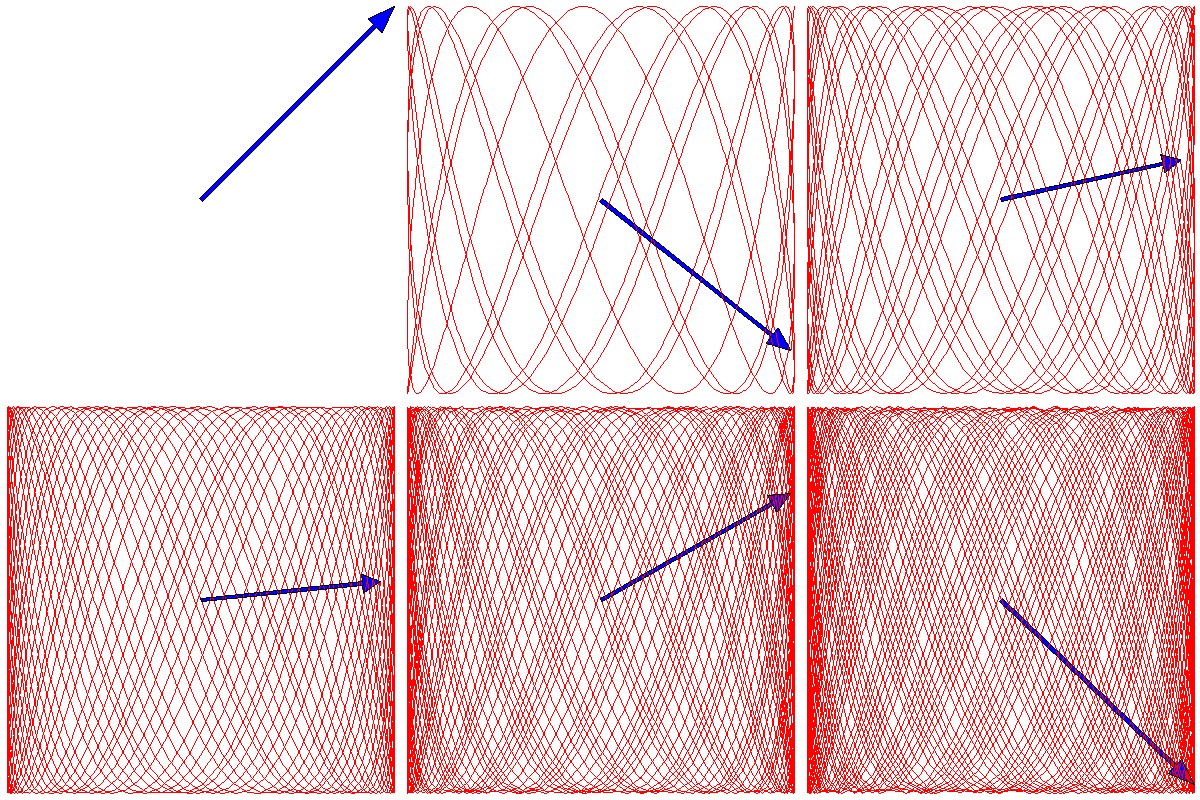
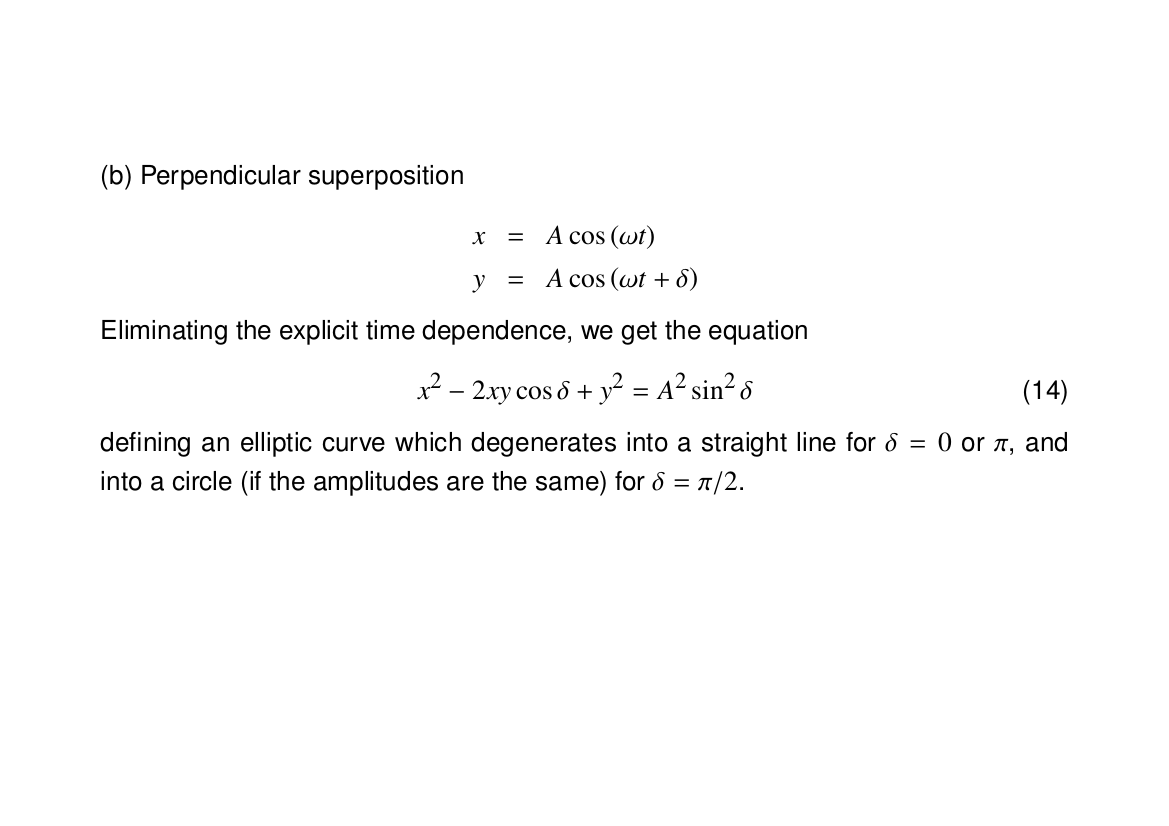
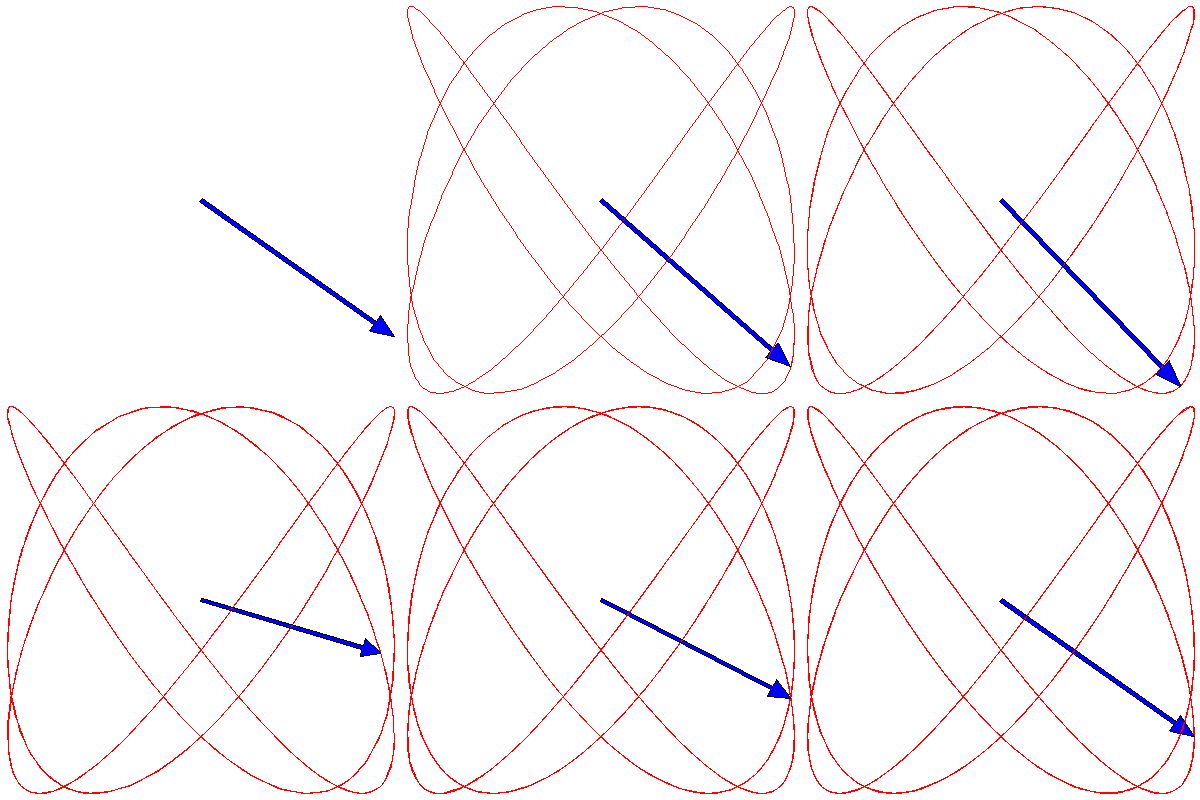
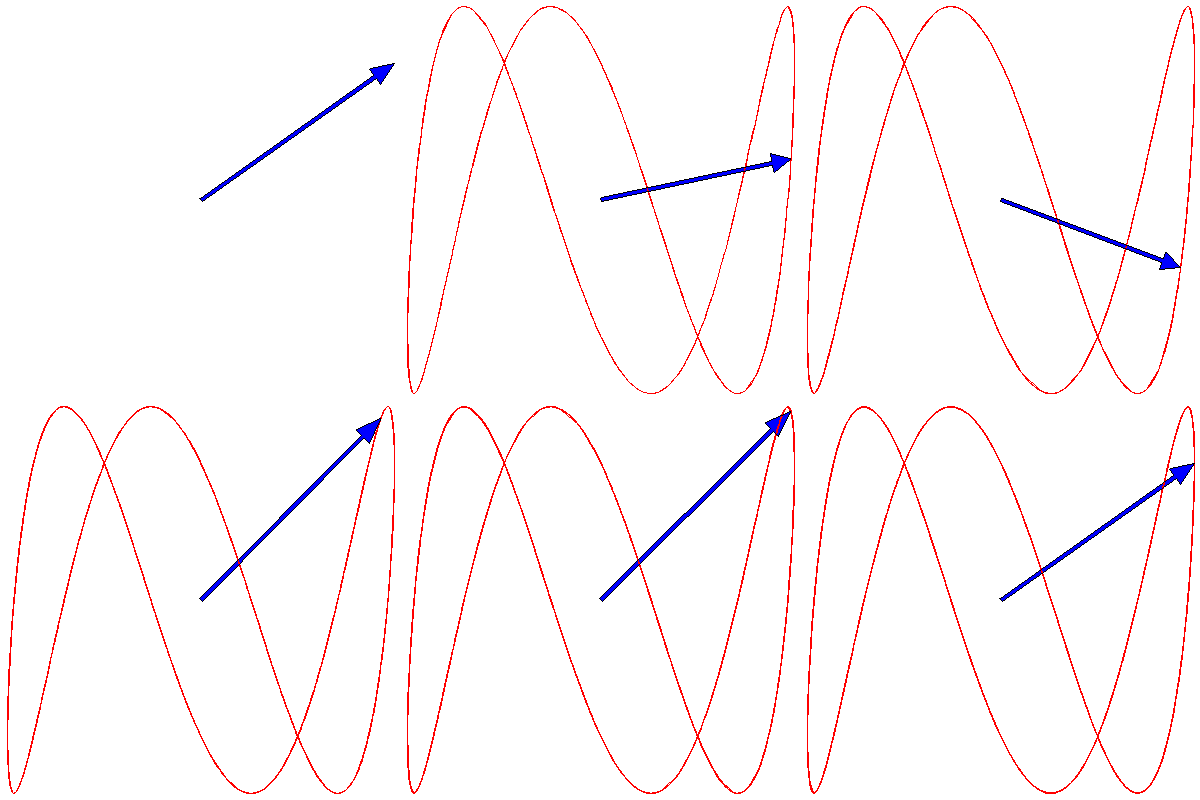
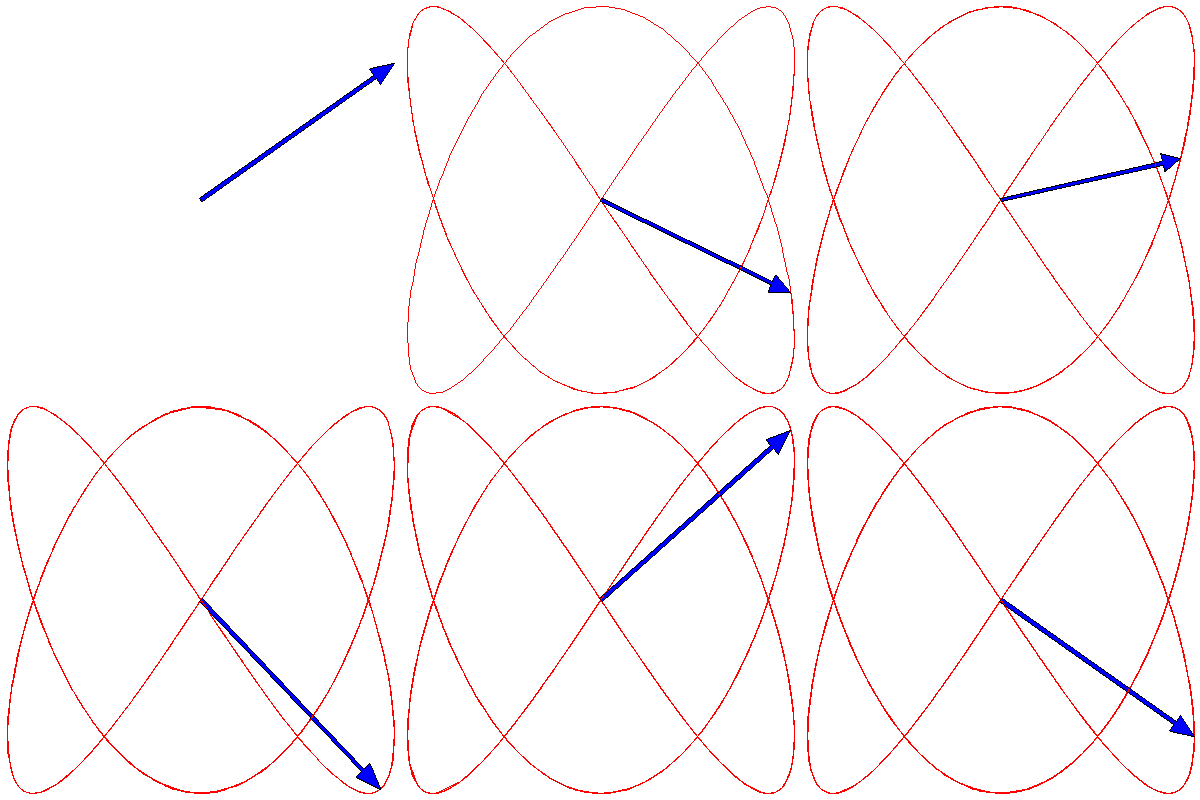
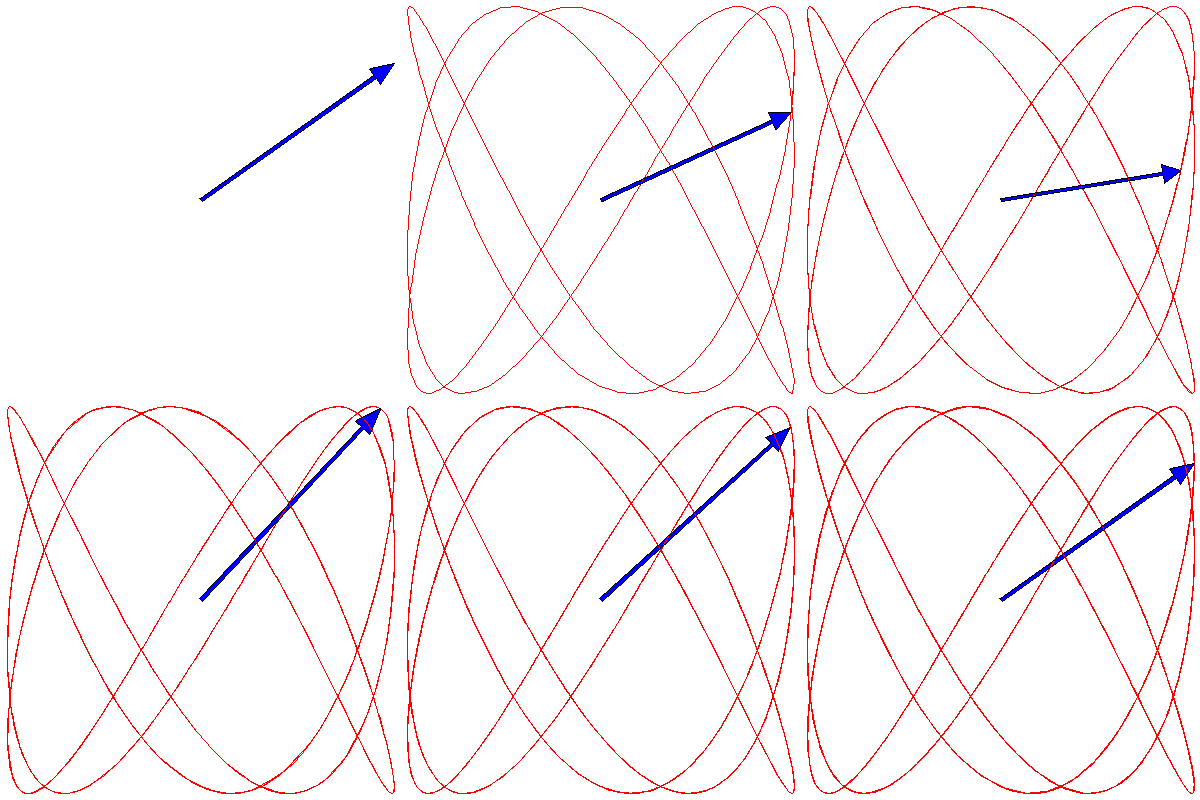
If the two oscillations are not colinear (as in the animations above) but are at right angles to each other, then the situation changes. These cases are usually described by Lissajous figures. The animations below show the progression of the sum (the blue arrow) of two perpendicular oscillations for different frequency ratios and phase differences. To be precise, the horizontal oscillation is $A\cos(\omega_1 t)$ and the vertical is $A\cos(\omega_2 t+\delta)$, where $\omega_1=3\pi \,\mathrm{rad}\cdot\mathrm{s}^{-1}$.
First, we show the effect of changing the phase difference. Here are the Lissajous figures for the frequency ratio $\omega_1:\omega_2=3:4$ with, going from left to right, $\delta=0$, π/4, π/2, 3π/4 and π:
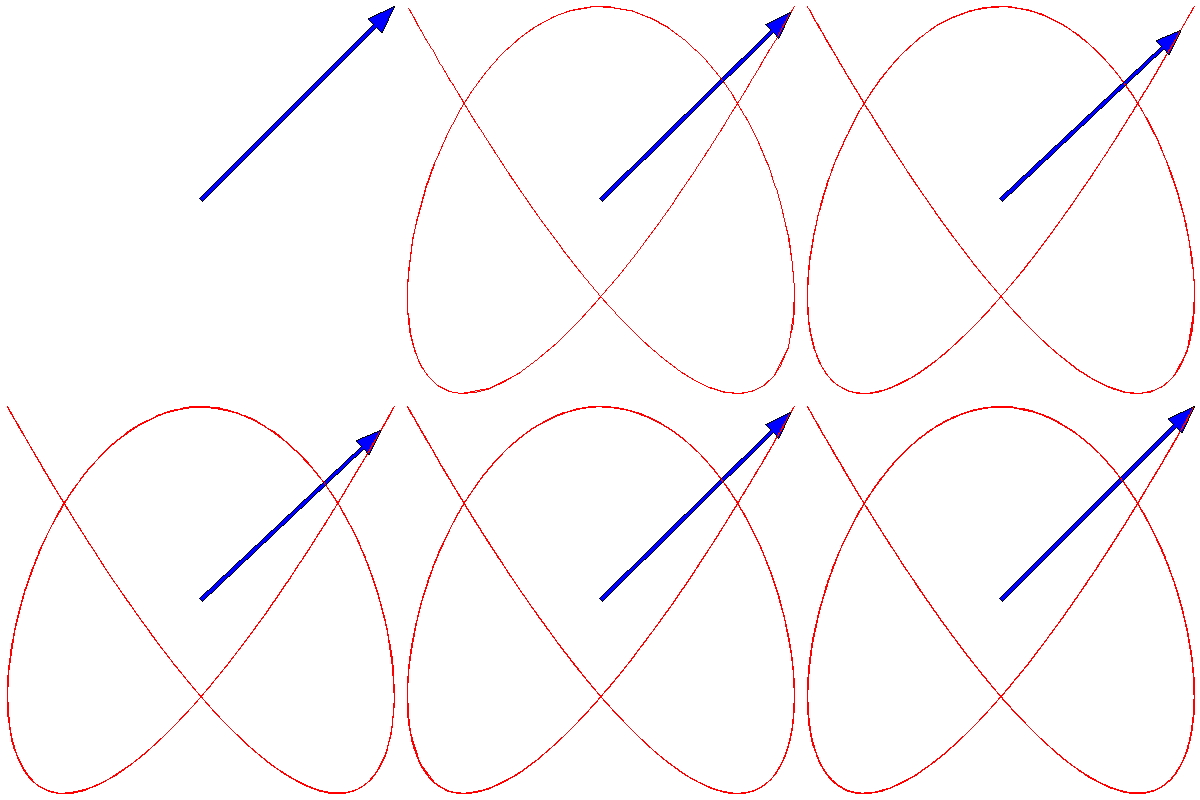
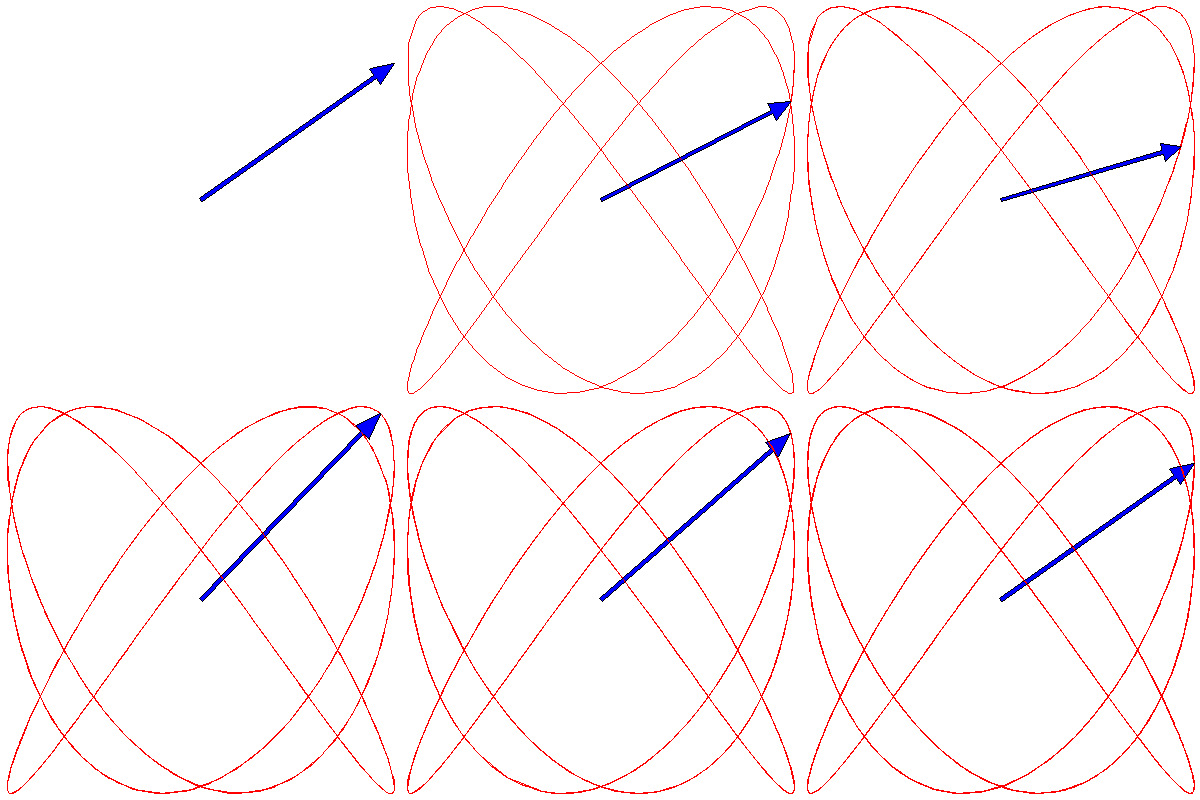
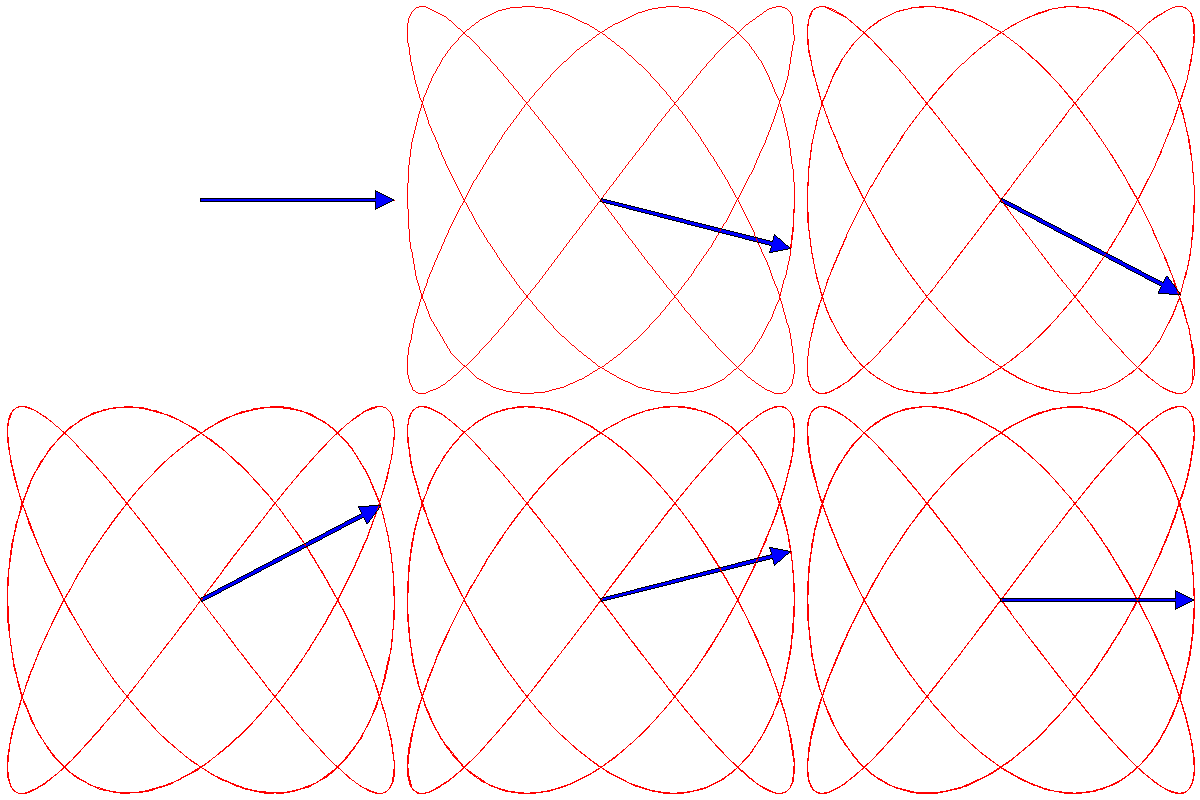
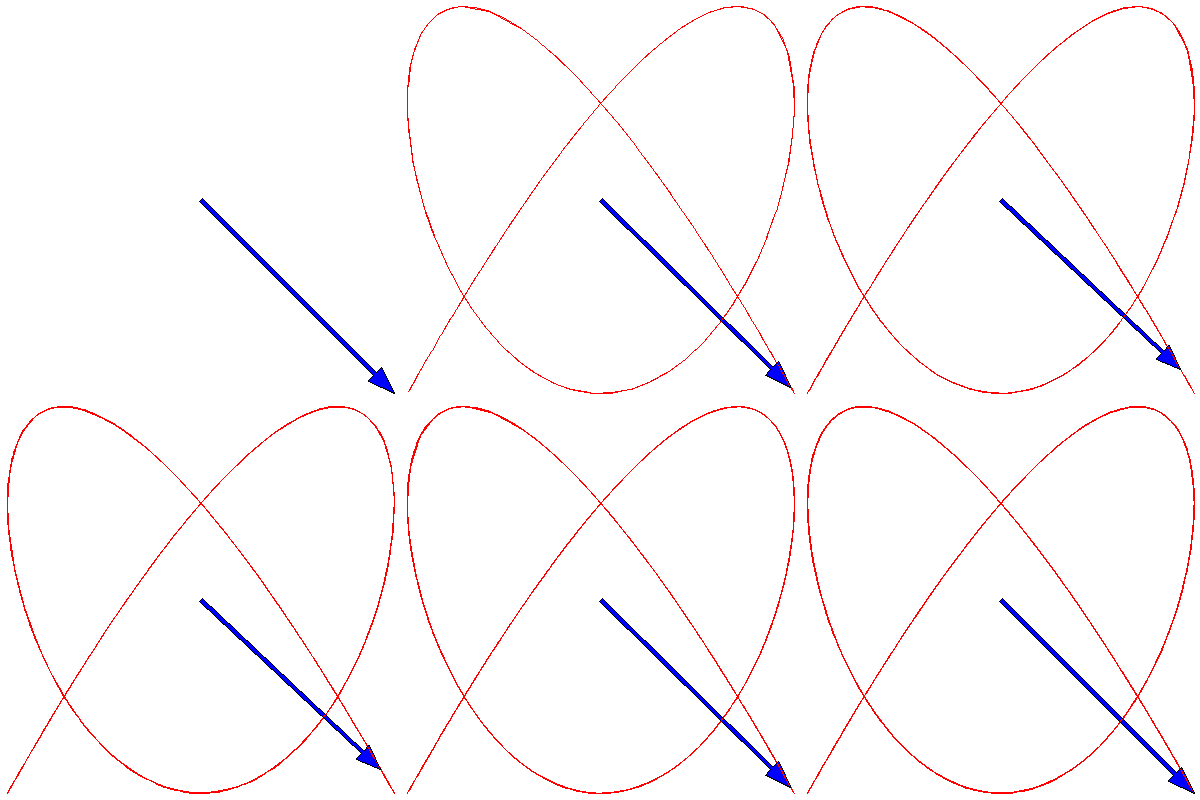
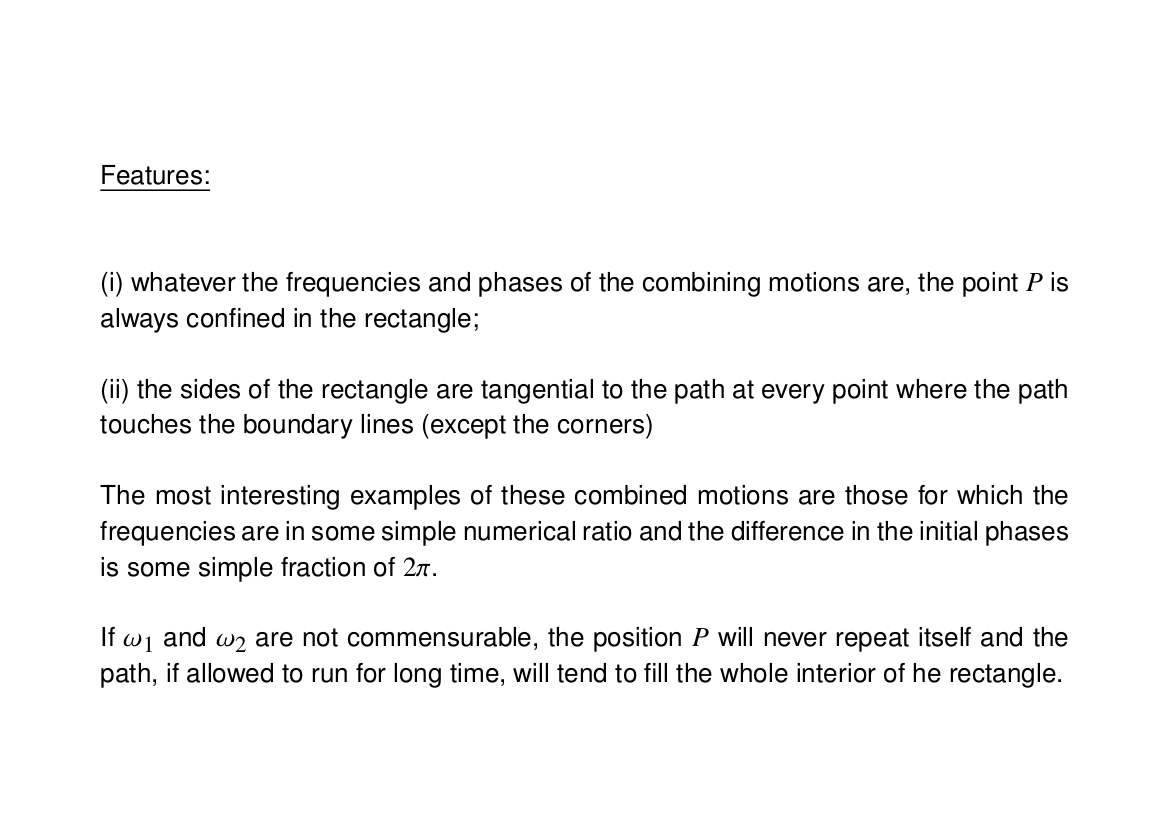
Now we fix $\delta$ to π/4 and change the frequency ratio; these are the figures for 1:1, 1:2, 1:3, 2:3, 3:4, 3:5, 4:5 and 5:6:
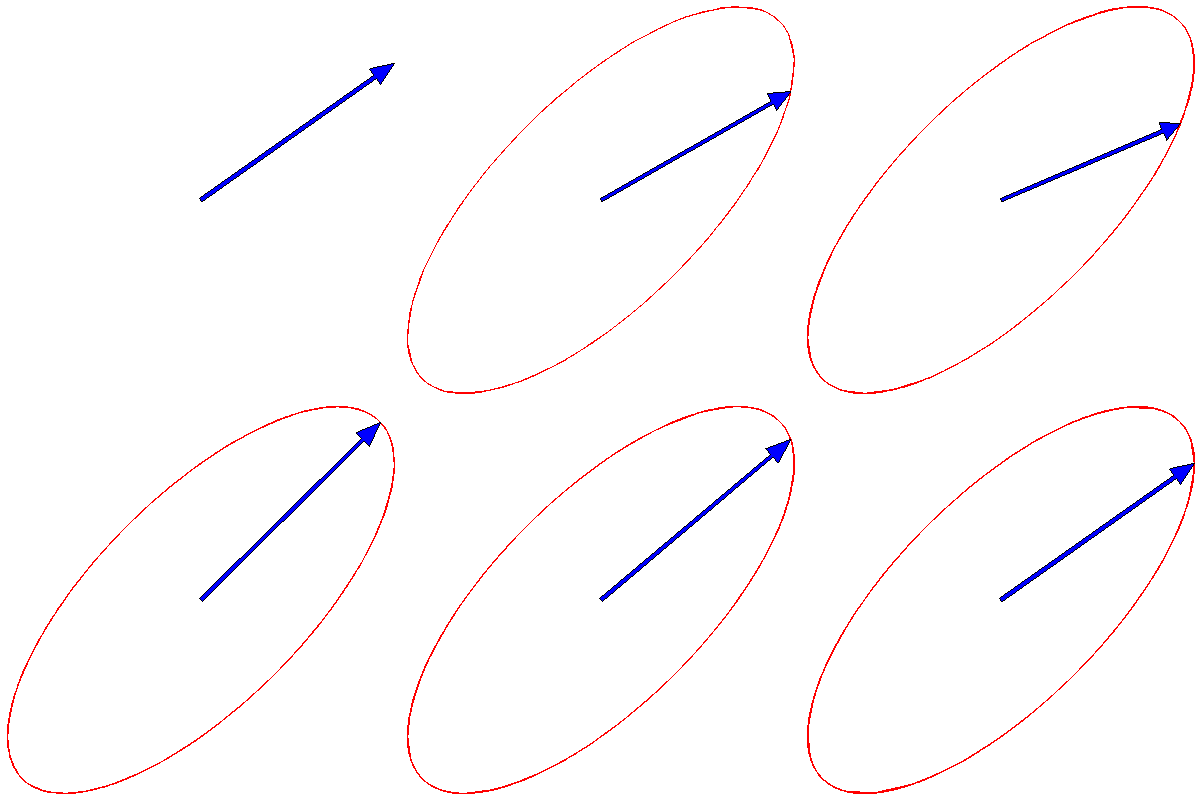
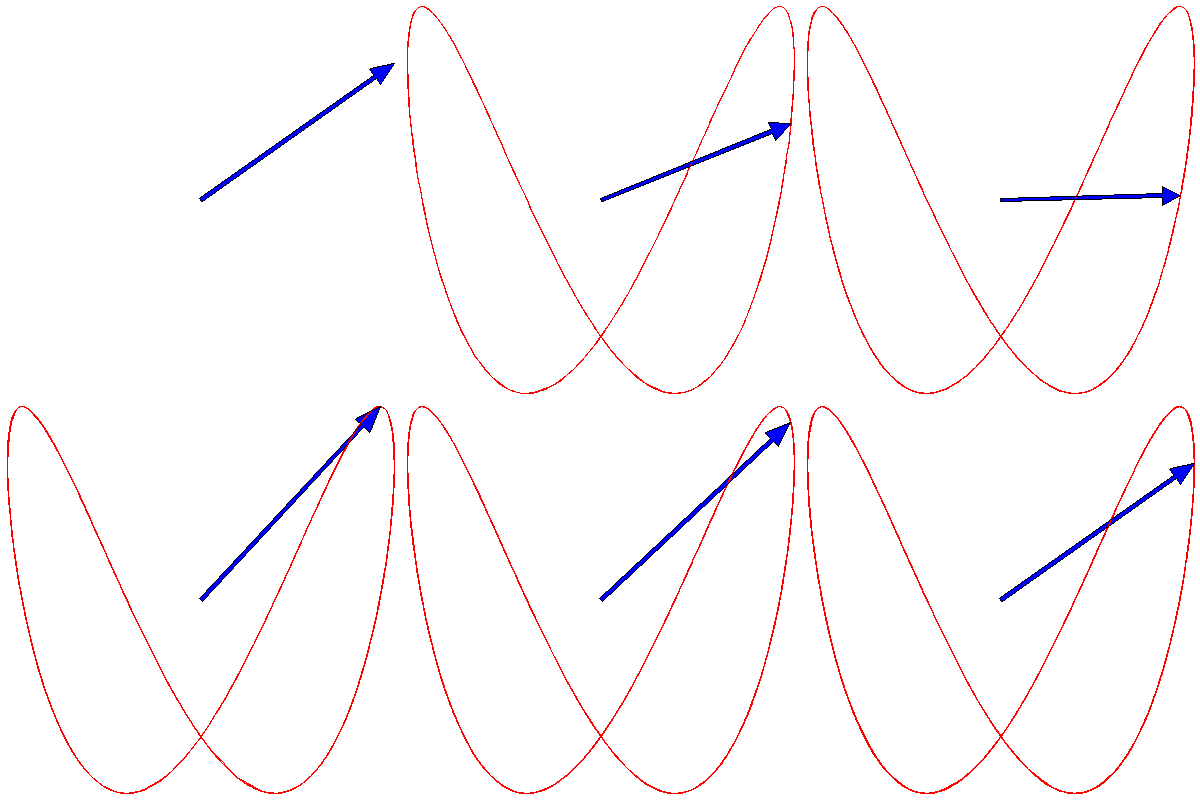

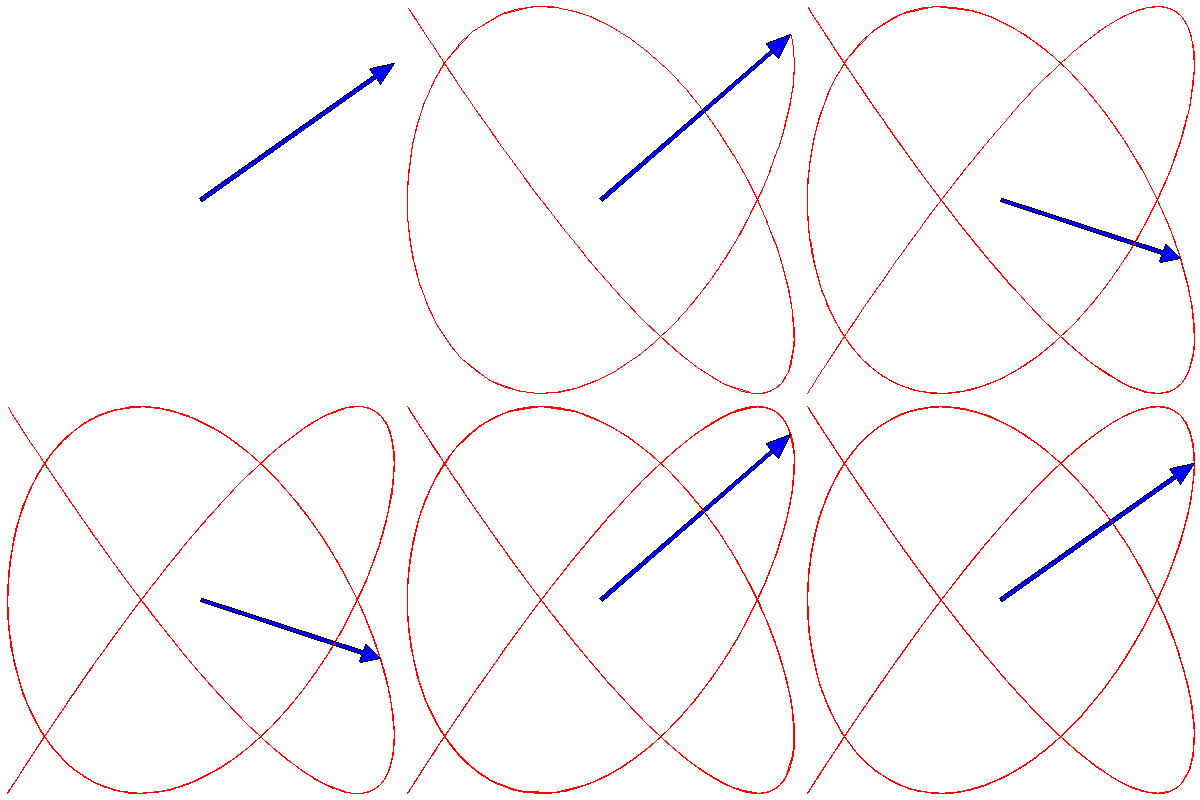
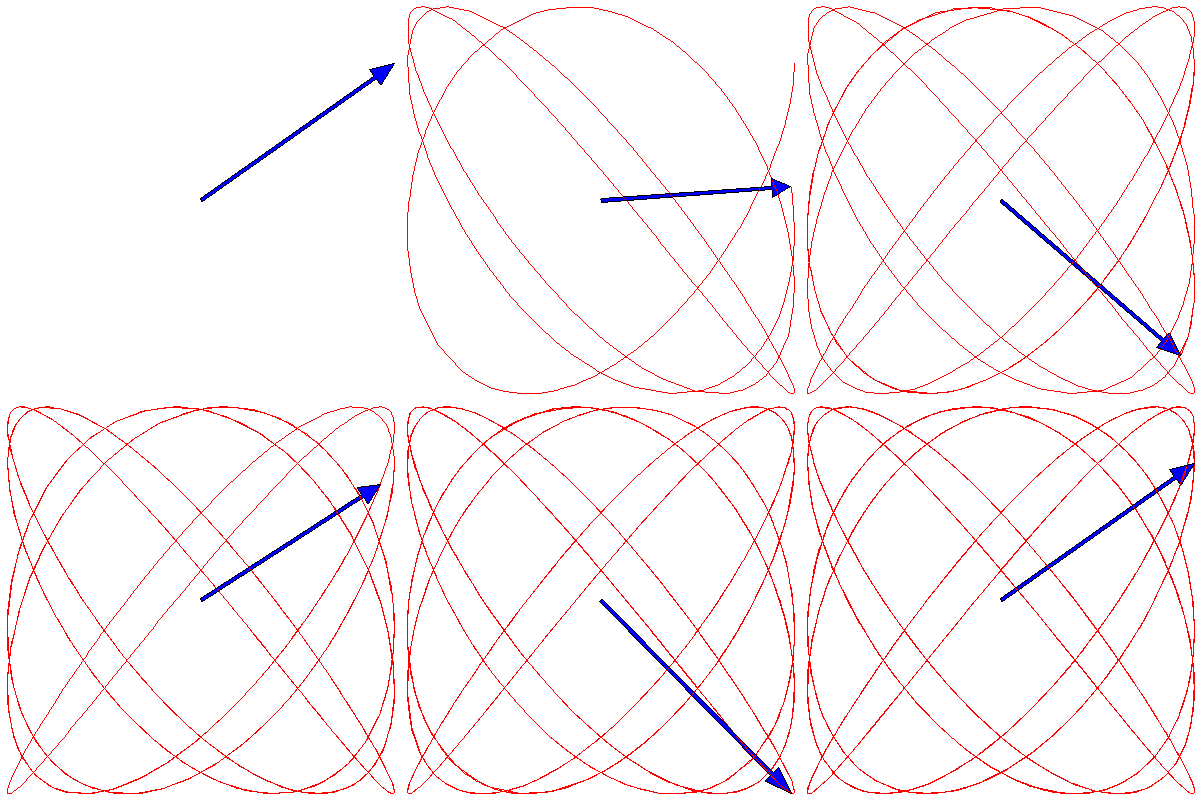
Because the frequency ratios in the above animations are rational, the Lissajous figures all eventually become closed curves. If the ratio is irrational, however, the curve will eventually fill the entire square. To illustrate this, below are three animations where the frequency ratios are $\sqrt{2}$, π/2 and $e$ (we have taken $\delta=0$ for each):
